Express.js
Send distributed traces to Last9 from an Express.js app using OpenTelemetry
Introduction
Express.js is widely recognized as the most popular web framework for Node.js. This comprehensive guide will help you instrument your Express.js application with OpenTelemetry, seamlessly sending the traces to Last9.
You can also check out the example application on GitHub↗.
Pre-requisites
- You have an Express.js application
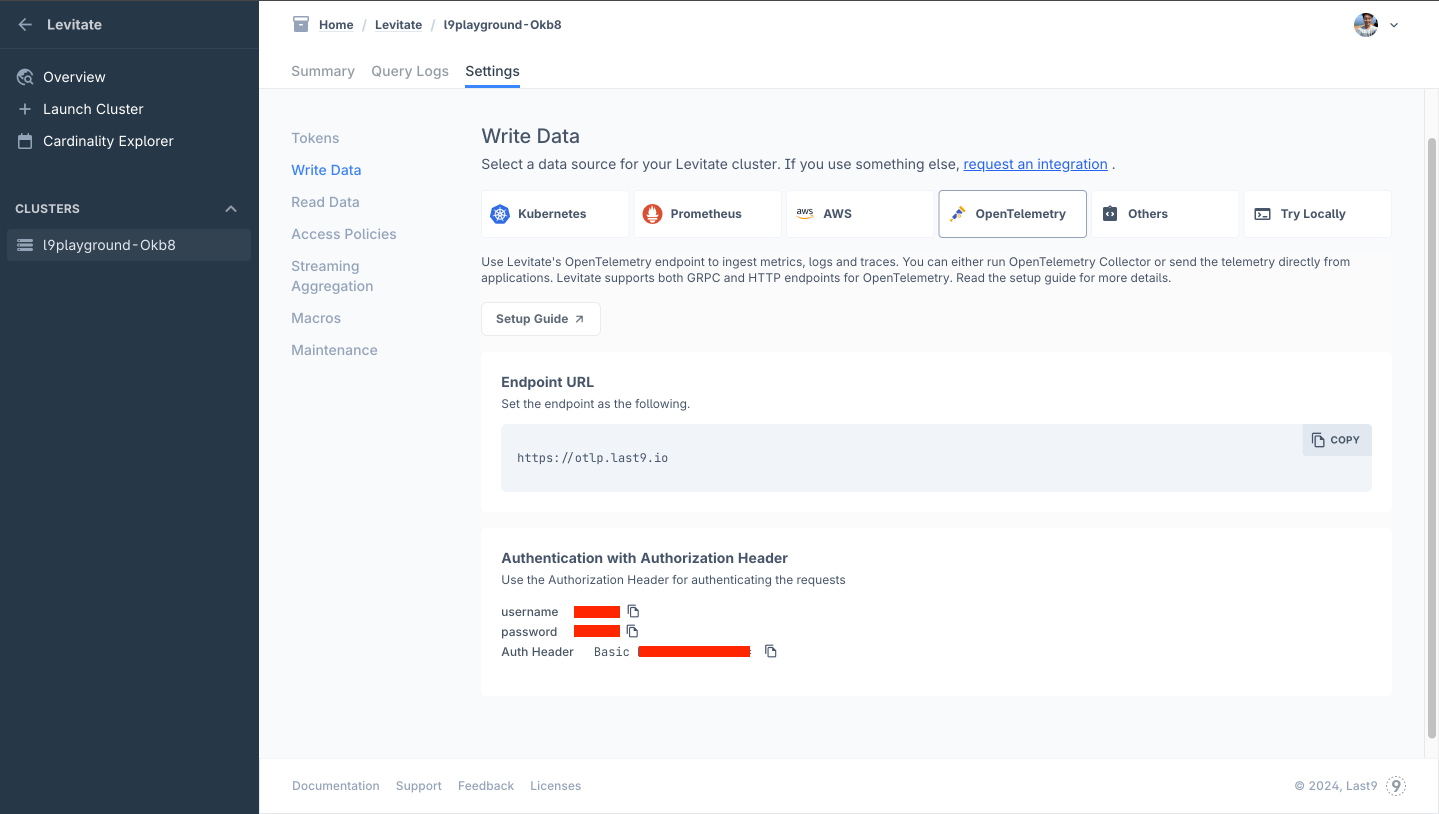
- You have signed up for Last9, created a cluster, and obtained the following OTLP credentials from the Integrations page:
endpointauth_header
Install OpenTelemetry packages
To perform the instrumentation, install the following OpenTelemetry packages.
npm install --save @opentelemetry/api \
  @opentelemetry/instrumentation \
  @opentelemetry/tracing \
  @opentelemetry/exporter-trace-otlp-http \
  @opentelemetry/resources \
  @opentelemetry/semantic-conventions \
  @opentelemetry/auto-instrumentations-node \
  @opentelemetry/sdk-node
To know more about them, you can check: https://opentelemetry.io/docs/languages/js/libraries/
Setup auto-instrumentation using OpenTelemetry
Add the necessary environment variables that can be obtained from the Integrations page.
OTLP_ENDPOINT=<ENDPOINT>
OTLP_AUTH_HEADER="Basic <BASIC_AUTH_HEADER>"
Next, create a file named instrumentation.ts and add the following code:
import {
  NodeTracerProvider,
  TracerConfig,
} from "@opentelemetry/sdk-trace-node";
import { BatchSpanProcessor } from "@opentelemetry/sdk-trace-base"; // Use BatchSpanProcessor for better performance
import { OTLPTraceExporter } from "@opentelemetry/exporter-trace-otlp-http"; // Import OTLPTraceExporter
import { registerInstrumentations } from "@opentelemetry/instrumentation";
import { getNodeAutoInstrumentations } from "@opentelemetry/auto-instrumentations-node";
import {
  SEMRESATTRS_SERVICE_NAME,
  SEMRESATTRS_DEPLOYMENT_ENVIRONMENT,
} from "@opentelemetry/semantic-conventions";
import { Resource } from "@opentelemetry/resources";

const providerConfig: TracerConfig = {
  resource: new Resource({
    [SEMRESATTRS_SERVICE_NAME]: "<your-service-name>",
    [SEMRESATTRS_DEPLOYMENT_ENVIRONMENT]: process.env.NODE_ENV,
  }),
};

// Initialize and register the tracer provider
const provider = new NodeTracerProvider(providerConfig);
const otlp = new OTLPTraceExporter({
  url: process.env.OTLP_ENDPOINT,
  headers: {
    Authorization: process.env.OTLP_AUTH_HEADER,
  },
}); // Configure the OTLP exporter

provider.addSpanProcessor(new BatchSpanProcessor(otlp));
provider.register();

// Automatically instrument HTTP and Express (additional instrumentations can be added)
registerInstrumentations({
  instrumentations: [
    getNodeAutoInstrumentations({
      // instrumentation-fs is disabled to reduce the noise of spans related to file operations
      "@opentelemetry/instrumentation-fs": {
        enabled: false,
      },
    }),
  ],
});
This above code performs the following steps:
- Set up Trace Provider with the application's name as Service Name.
- Set up OTLP Exporter with Last9 OTLP endpoint.
- Set up auto instrumentation.
Next, this script must be imported at the application's entry point. For instance, if you have server.ts as your entry file, then import it at the top of the file as follows:
// server.ts

import "./instrumentation.ts";

// Application Code...
You can also use instrumentation.js if you are not using Typescript.
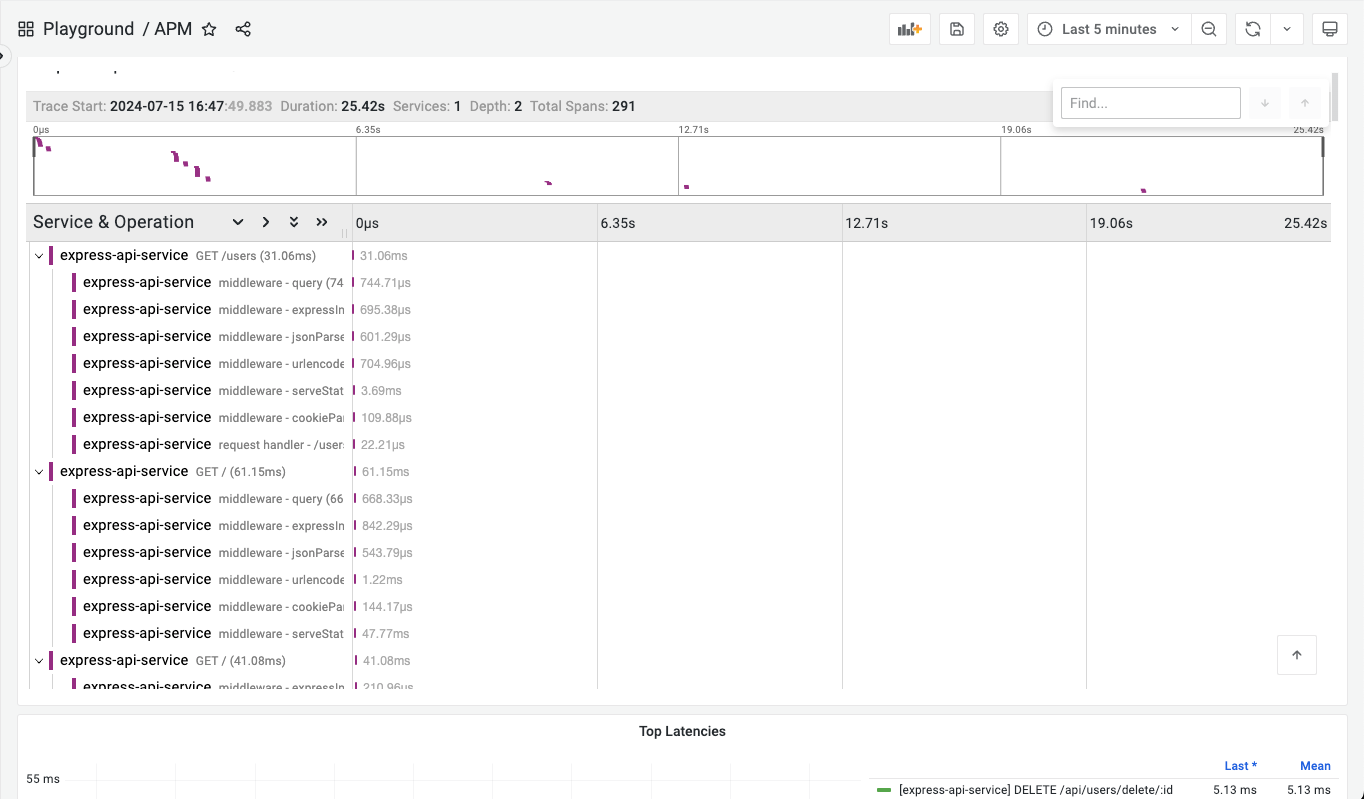
Visualize the traces in Last9
Once the application runs with the above code, it will start pushing traces to Last9. You can see the result in action by looking at the APM dashboard in Last9.
Troubleshooting
Please get in touch with us on Discord or Email if you have any questions.