Query
Control Plane tools for query-level configurations.
Macros
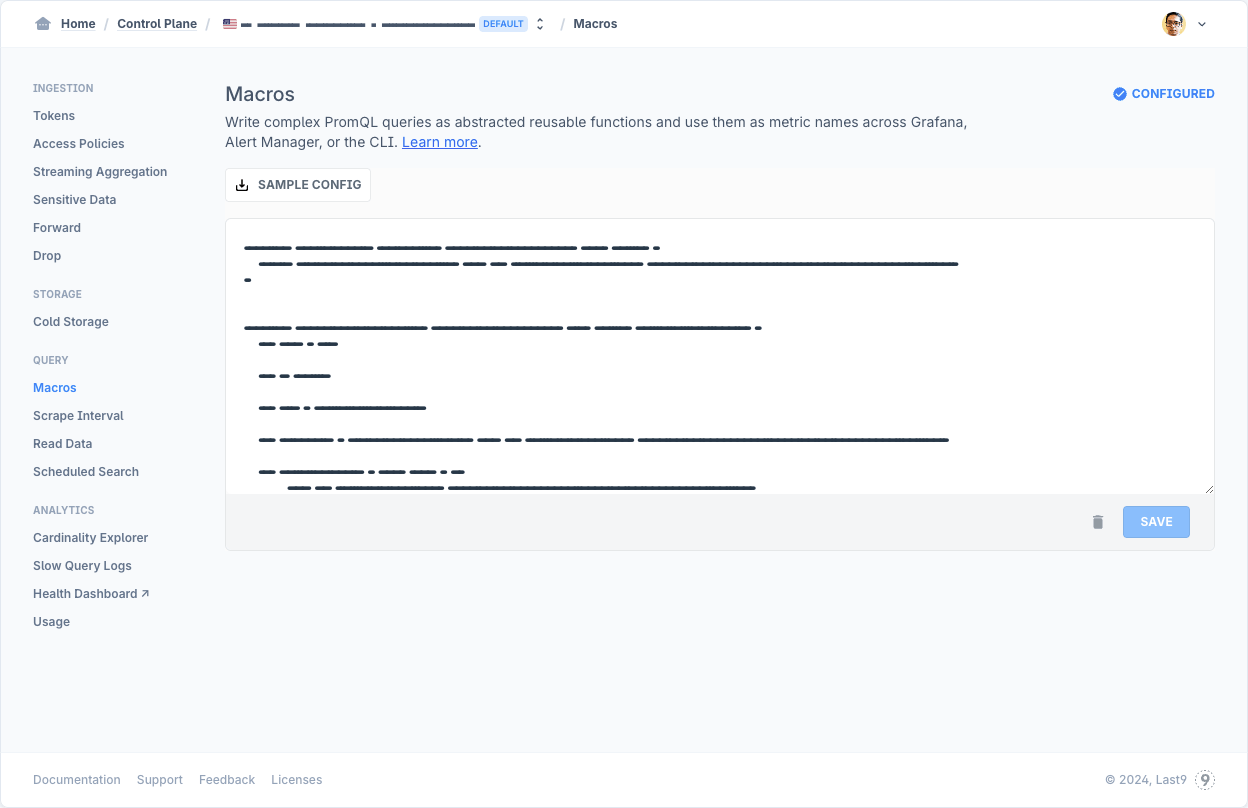
They work in a way that is similar to how SQL developers use stored procedures. Macros take full advantage of the time-tested best practices of functions, abstractions, and reusability to replace cumbersome and error-prone methods.
Simplify your PromQLs that are reused often to avoid repition of code, and improve abstractions and readability. Read more on how to configure these macros.
Scrape Interval
Set this to the typical scrape and evaluation interval configured in your agent’s config file. If you set this to a greater value than your agent’s config file interval, the embedded Grafana in Explore will evaluate the data according to this interval and you will see less data points.
Notes:
- Defaults to 1m.
- This does not change your agent’s scrape interval.
Read Data
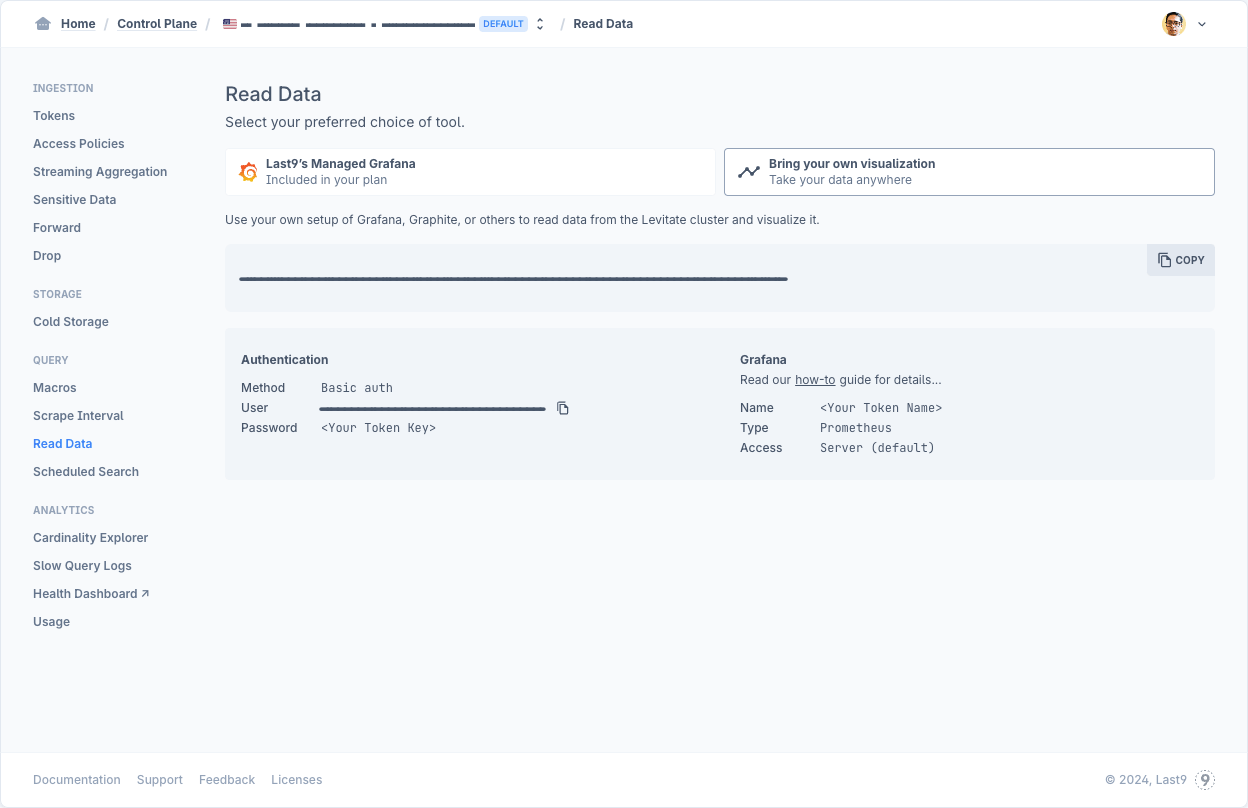
If you're looking to use your stored telemetry data outside of Last9's Alerting or Managed Grafana, you can refer to the Read Data settings to configure your choice of visualization tool.
For additional settings on how to configure your own Grafana to use Last9 as a datasource, read this.
Scheduled Search
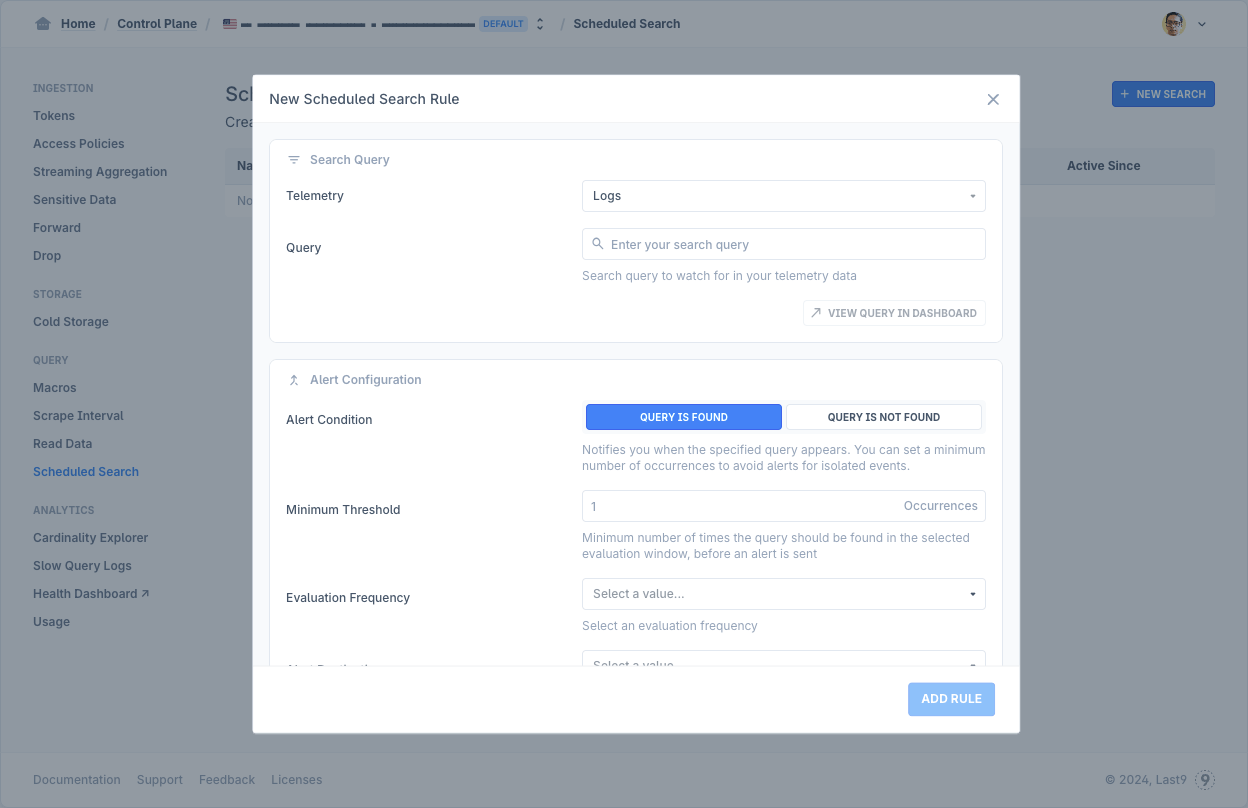
Create periodic searches on telemetry data and set alerts when patterns are found or missing. Read more on how configure these alerts.
Supported telemetry types: Logs, and Traces coming soon.
Troubleshooting
Please get in touch with us on Discord or Email if you have any questions.