Analytics
Control Plane tools to understand and debug system usage and performance.
Cardinality Explorer
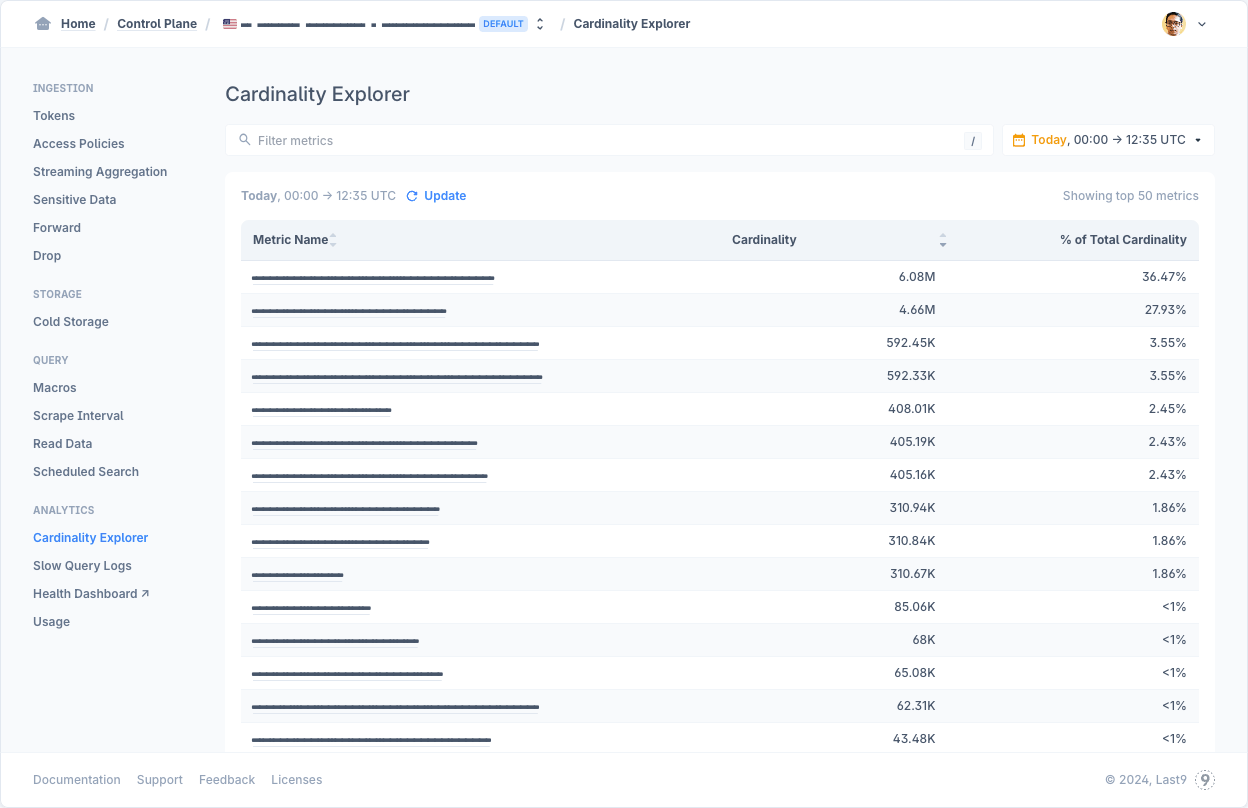
While Last9 offers superior defaults on per-metric per-day cardinality, you may need to identify the metrics and its labels that are impacted. Cardinality Explorer helps you understand how the cardinality for metrics and its labels is trending. This enables you to diagnose cardinality-related challenges with your metrics. Read more on how to use the Cardinality Explorer interface.
Slow Query Logs
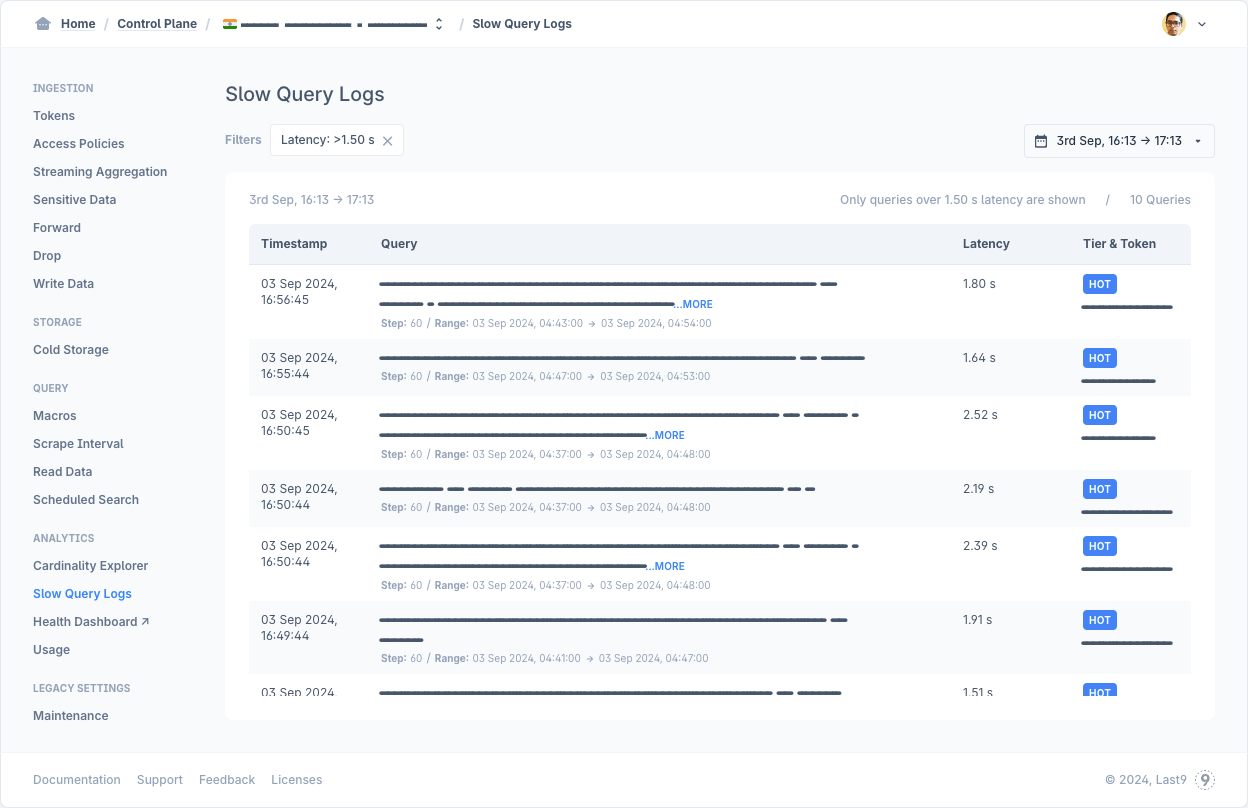
Quickly identify which queries are taking the longest to debug and optimize them. These queries could be originating from either Last9's alerting, managed Grafana explore/dasboards, or from your own read workfloads. You can change the latency values on the filter to see slower queries, but the minimum is queries taking longer than 1 second. By default, logs are displayed for the last 1 hour, but the window can be customized to a maximum of last 24 hours.
Health Dashboard
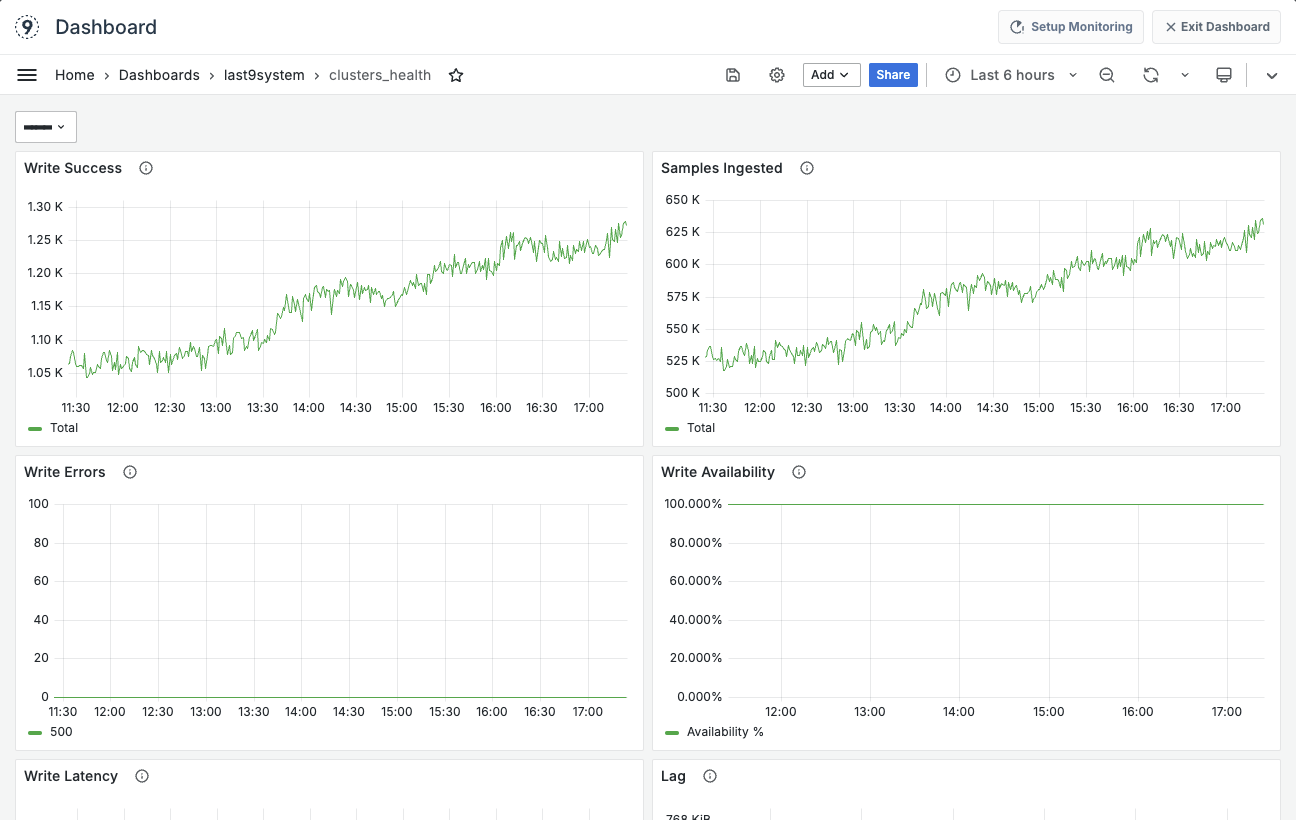
While Last9 provides an SLA of 99.9% writes and 99.5% reads, you can also view the health of Last9 by clicking on Health Dashboard. You are redirected to a system-generated Grafana dashboard with panels for availability, successes/errors, latencies, lags, bytes dropped, and more.
Usage
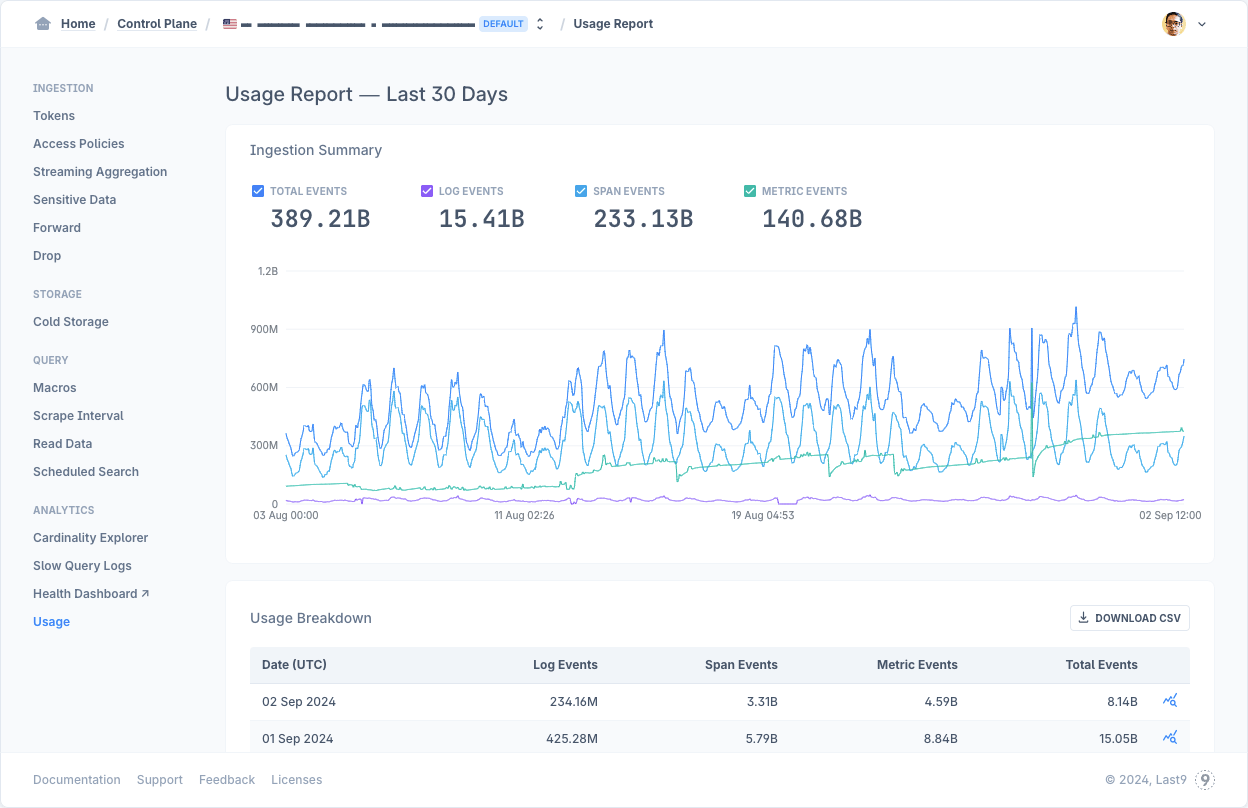
View the ingestion trend and usage breakdown for your telemetry data by total and types (log, span, and metric events). By default, a summary of the last 30 days is displayed. You can select an area on the chart to zoom in or you can click on the icon in each date row of the breakdown table to view an hourly breakdown. You can also click on "Download CSV" to get a hourly breakdown for the last 30 days.
What is an Event?
Usage numbers are shown as Total Events. Each log line, trace span, and metric sample that is ingested by Last9 is considered an event. The number of events is calculated at the ingestion layer, before the data is used by any of the ingestion pipelines like Streaming Aggregation, Sensitive Data, Forward, and Drop.
Troubleshooting
Please get in touch with us on Discord or Email if you have any questions.