Cluster Overview
To start using Last9 you need at least one Cluster, from which you read and write metric data. In this document, we dive deep into all things related to a cluster.
To get up and running fast, see our Quick Start Guide.
Think of a Cluster as a logically separated, Prometheus API-compatible data source for all your metric data. You can create as many Clusters as you want, the number of clusters has no impact on your billing.
It is typically recommended that you create Clusters for each of your environments. Example: Production Cluster, Staging Cluster, etc.
Creating a New Cluster
To create a Cluster:
-
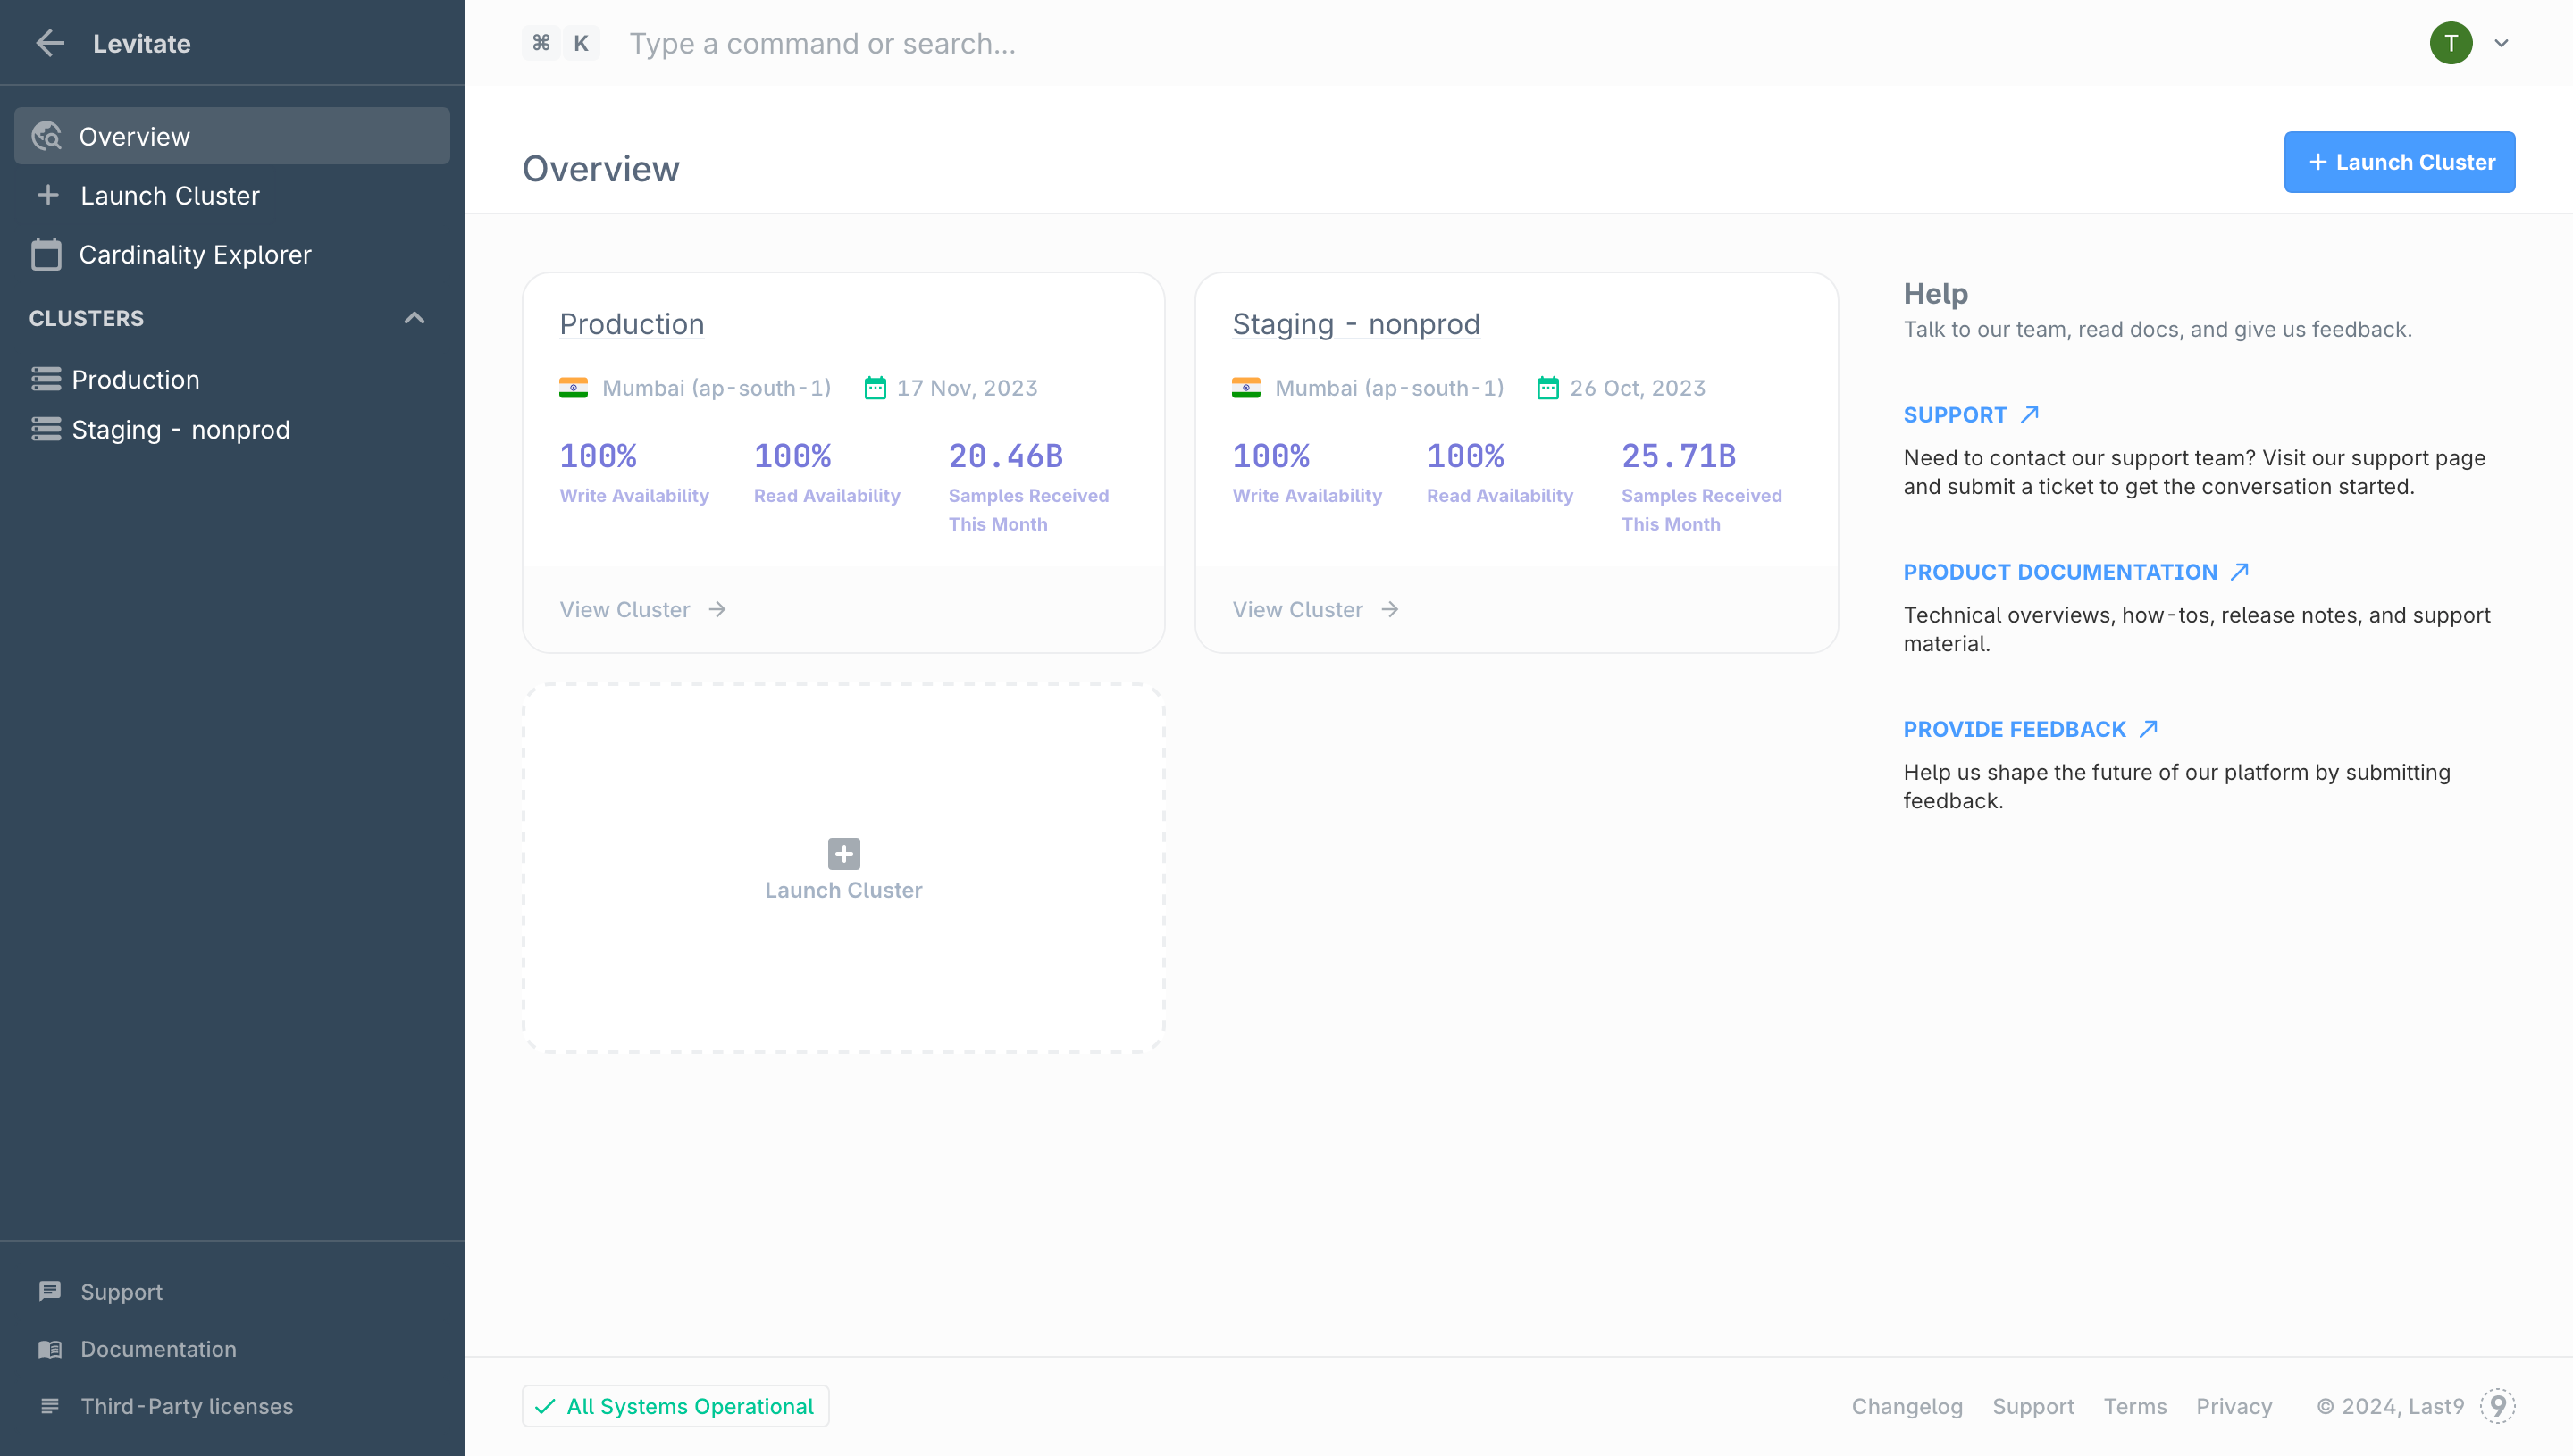
Navigate to Home → Levitate
-
Click the Launch Cluster button to launch the setup wizard
-
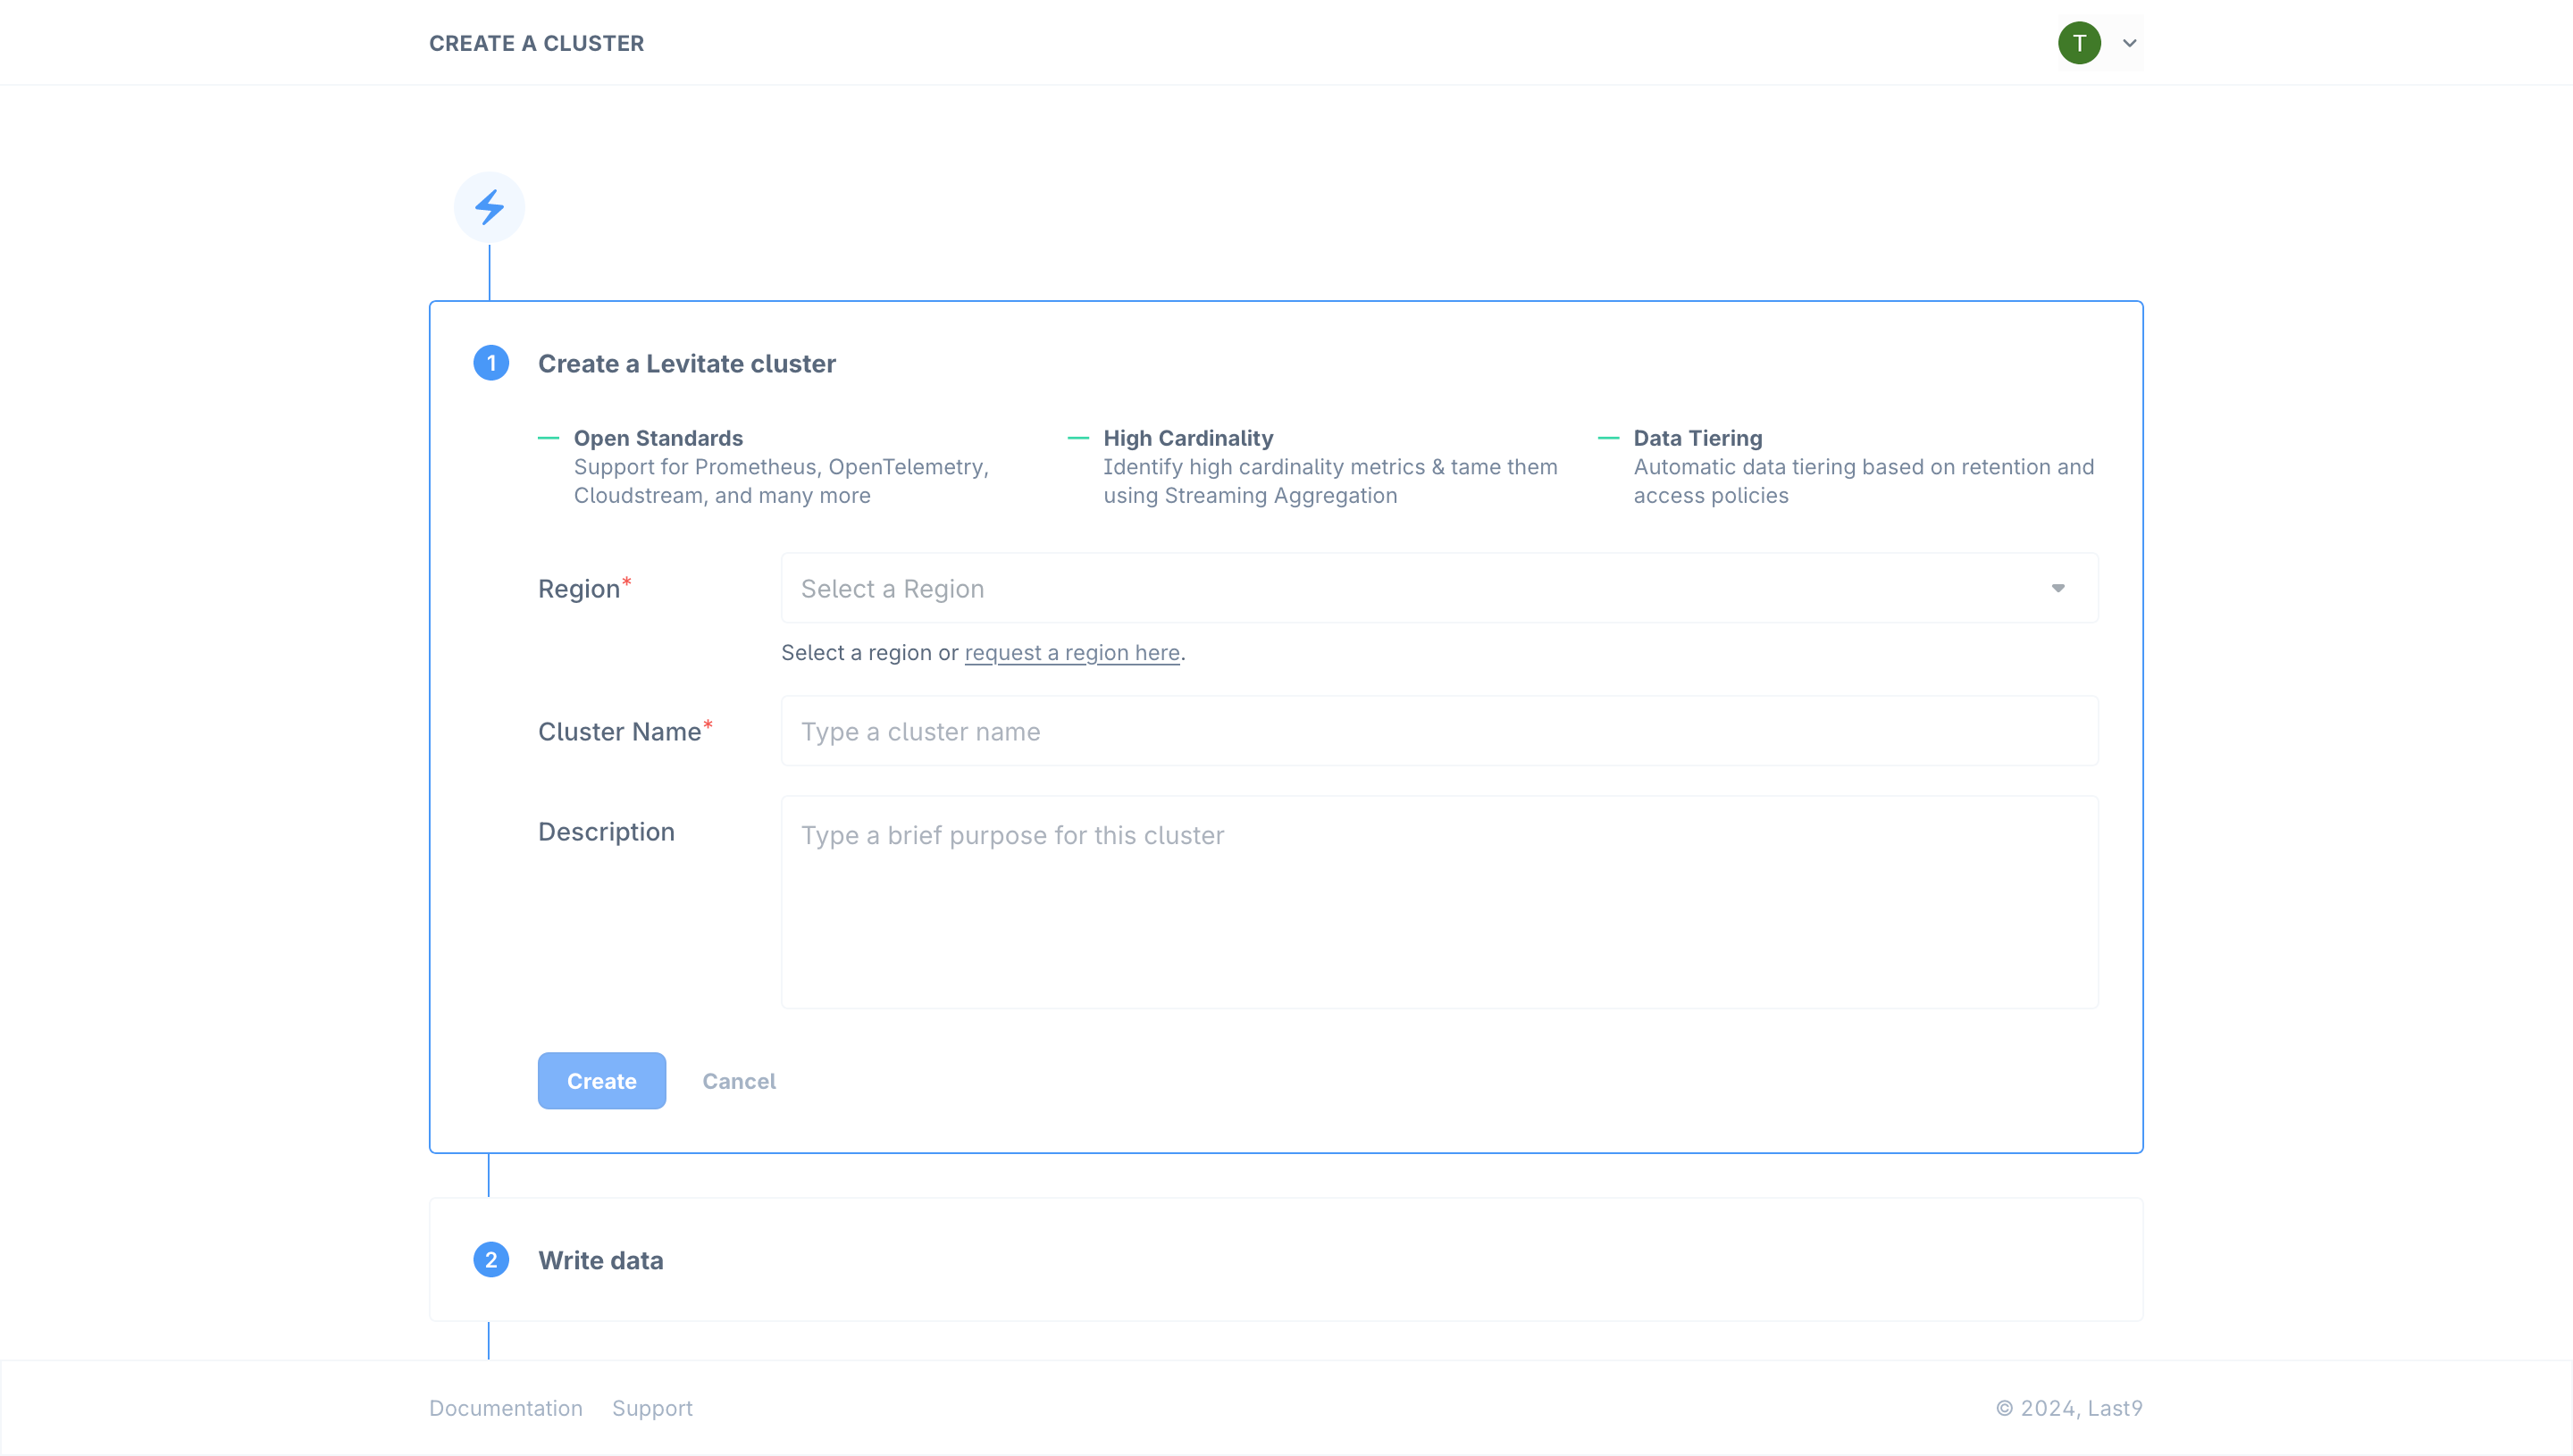
Select the AWS region you would like to deploy the cluster in. This should ideally be the same region as your application
-
Give the Cluster a descriptive name
-
Optionally, add a description which will be displayed on the Cluster Overview screen
-
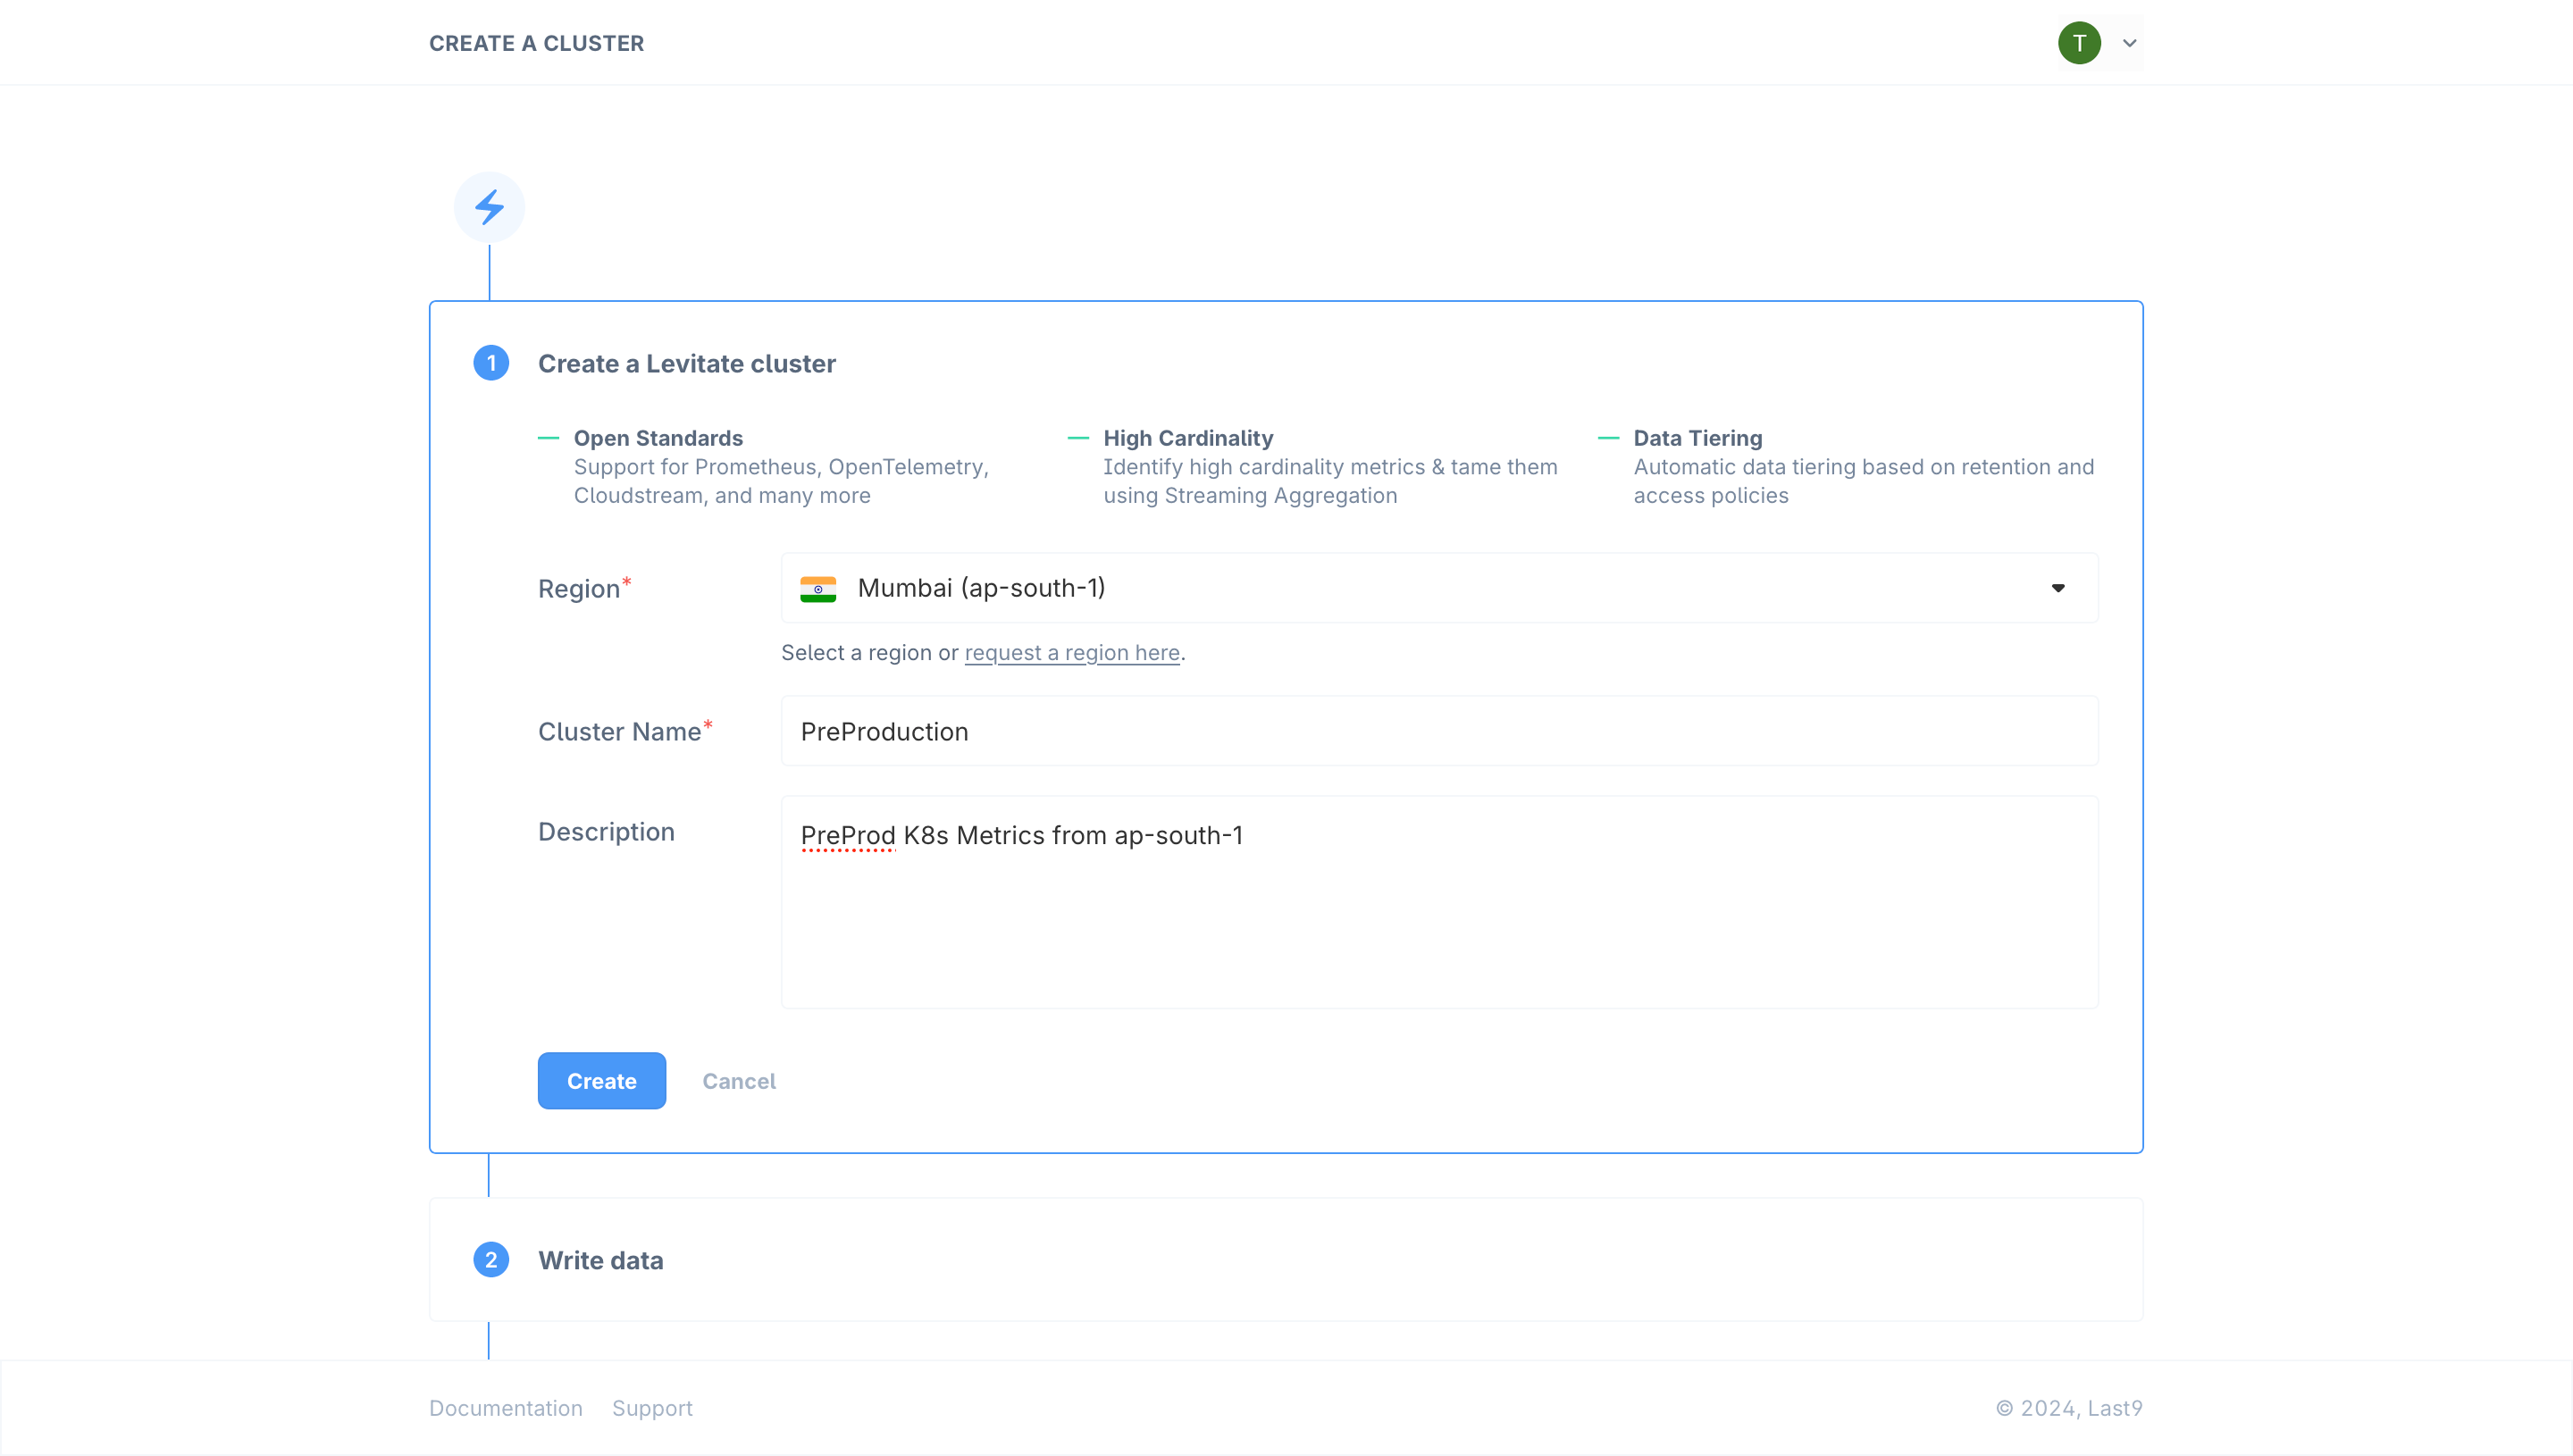
Press the Create to create your new Cluster As the Cluster gets created, you will be presented with an access token that is automatically created. This token is required to start writing & reading data to the Cluster. Tokens are only shown once, so please copy or download credentials (or you can always create another token from Cluster settings).
 Your new Cluster is now ready to receive metrics.
 -
To start writing data to this new Cluster, please follow the Write Data steps start writing data from Kubernetes, Prometheus, AWS/CloudStream or quickly try out by running a local demo environment
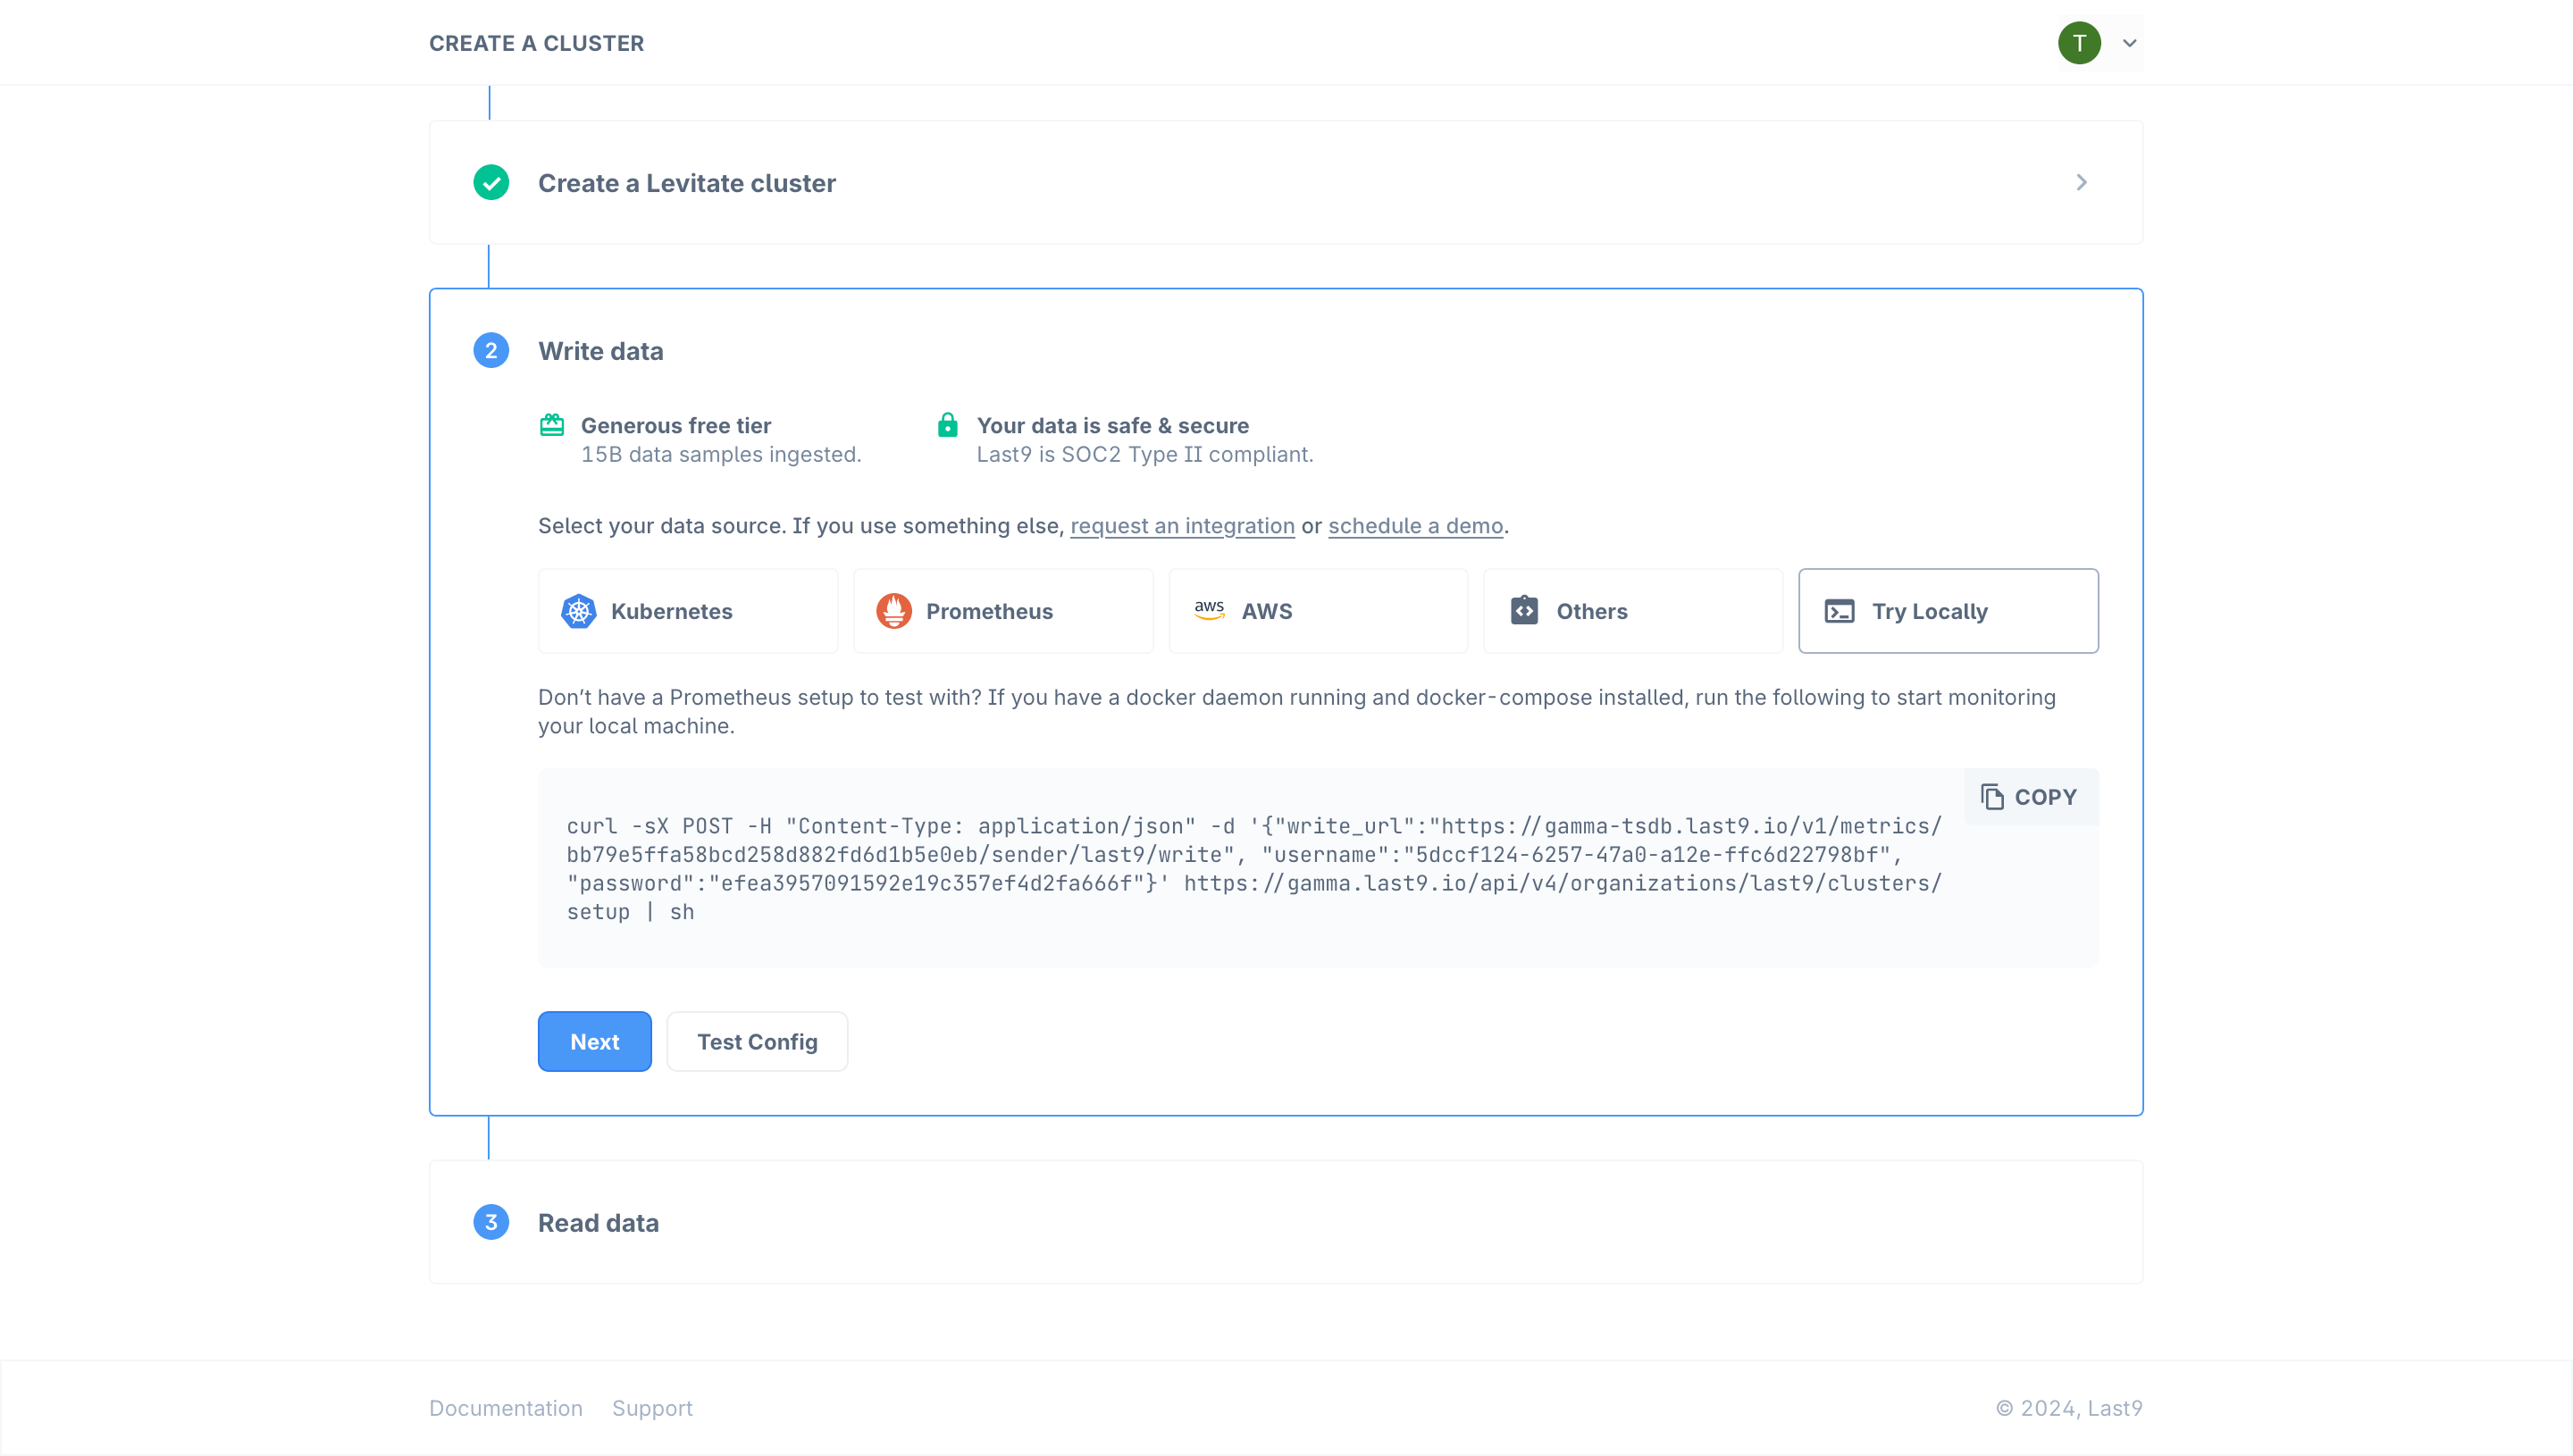 Using the Test Config button you can verify if your Last9 cluster has started receiving data.
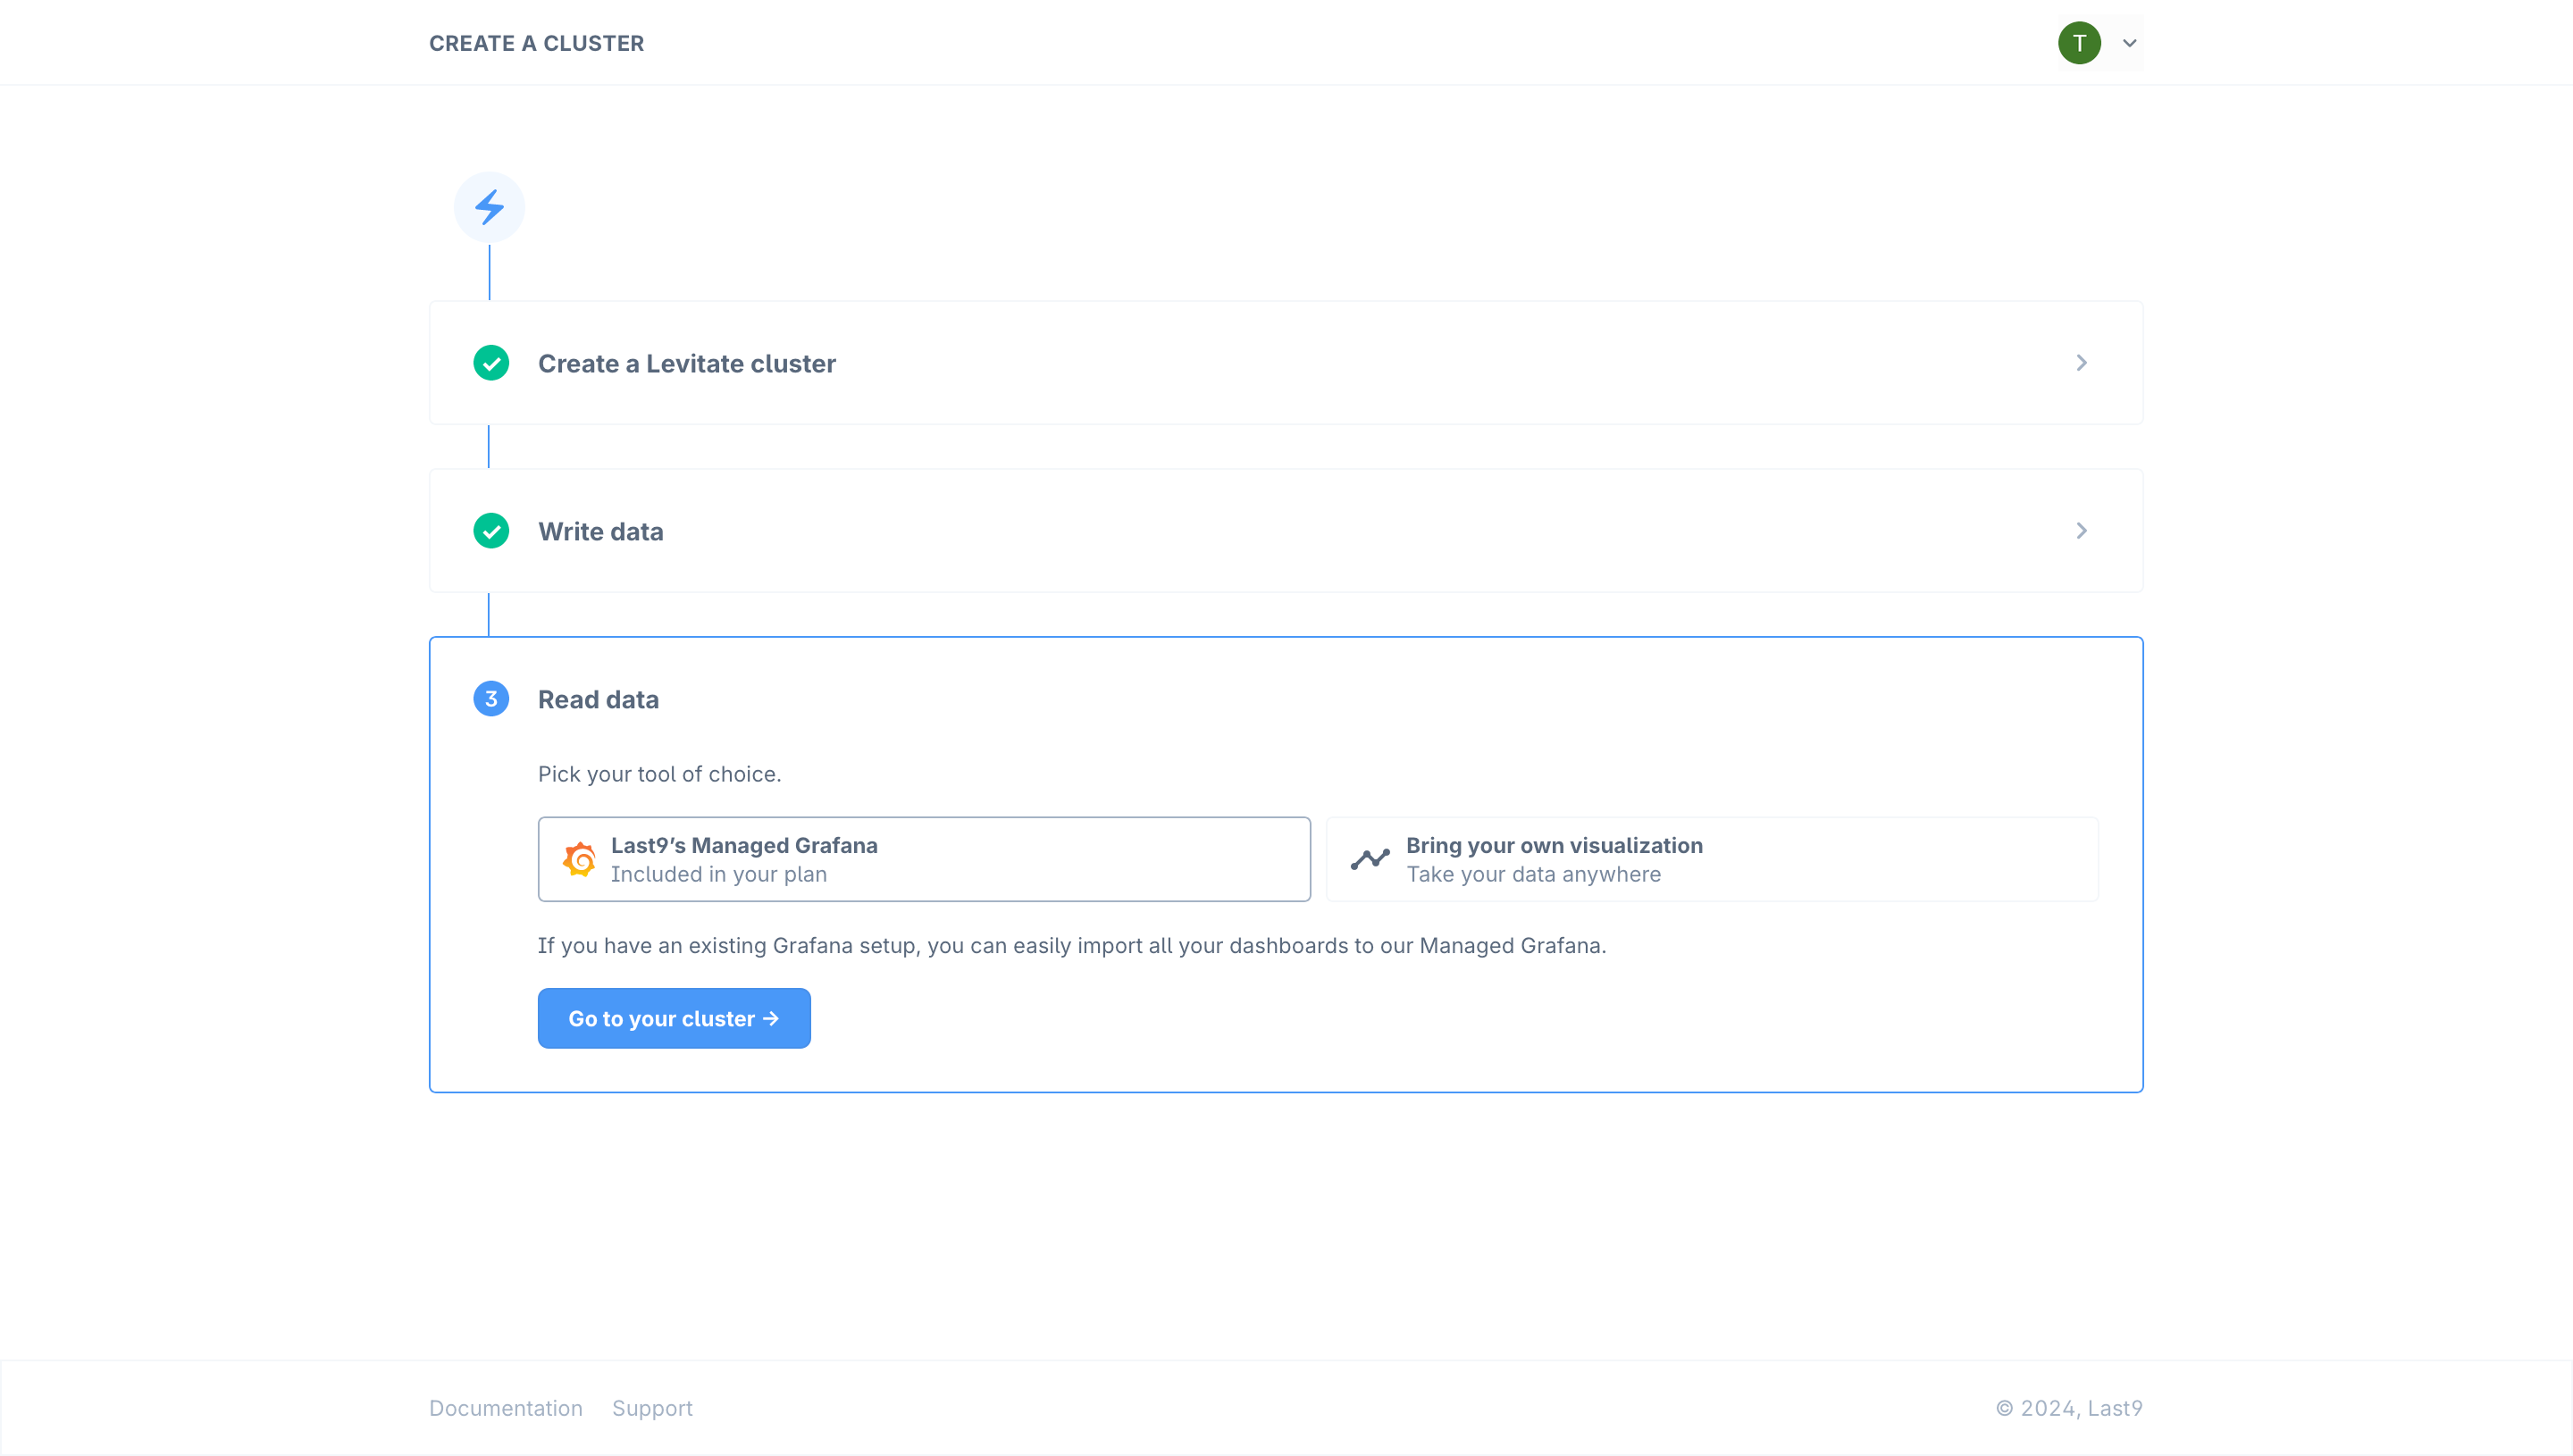
Click the Next button to start reading data/querying metrics from your Cluster.
Using the Test Config button you can verify if your Last9 cluster has started receiving data.
Click the Next button to start reading data/querying metrics from your Cluster.See our guides on how you can send data from Prometheus, OpenTelemetry, VMAgent, or other various sIntegrations supported. 8. To start reading metrics from your new Cluster you can use Managed Grafana which comes included with every plan.
Alternatively, you can use the provided Read URL to read data using any Prometheus HTTP API Compatible tool like AlertManager, your own Grafana, KEDA, etc. See the guide on how to connect your own Grafana with a Last9 cluster.
Managing a Cluster
Cluster Usage and Performance
Last9 provides the following tools to observe the Cluster’s performance:
- Cluster Health Dashboard - Performance & usage metrics report
- Query Logs - Identify slow-running queries
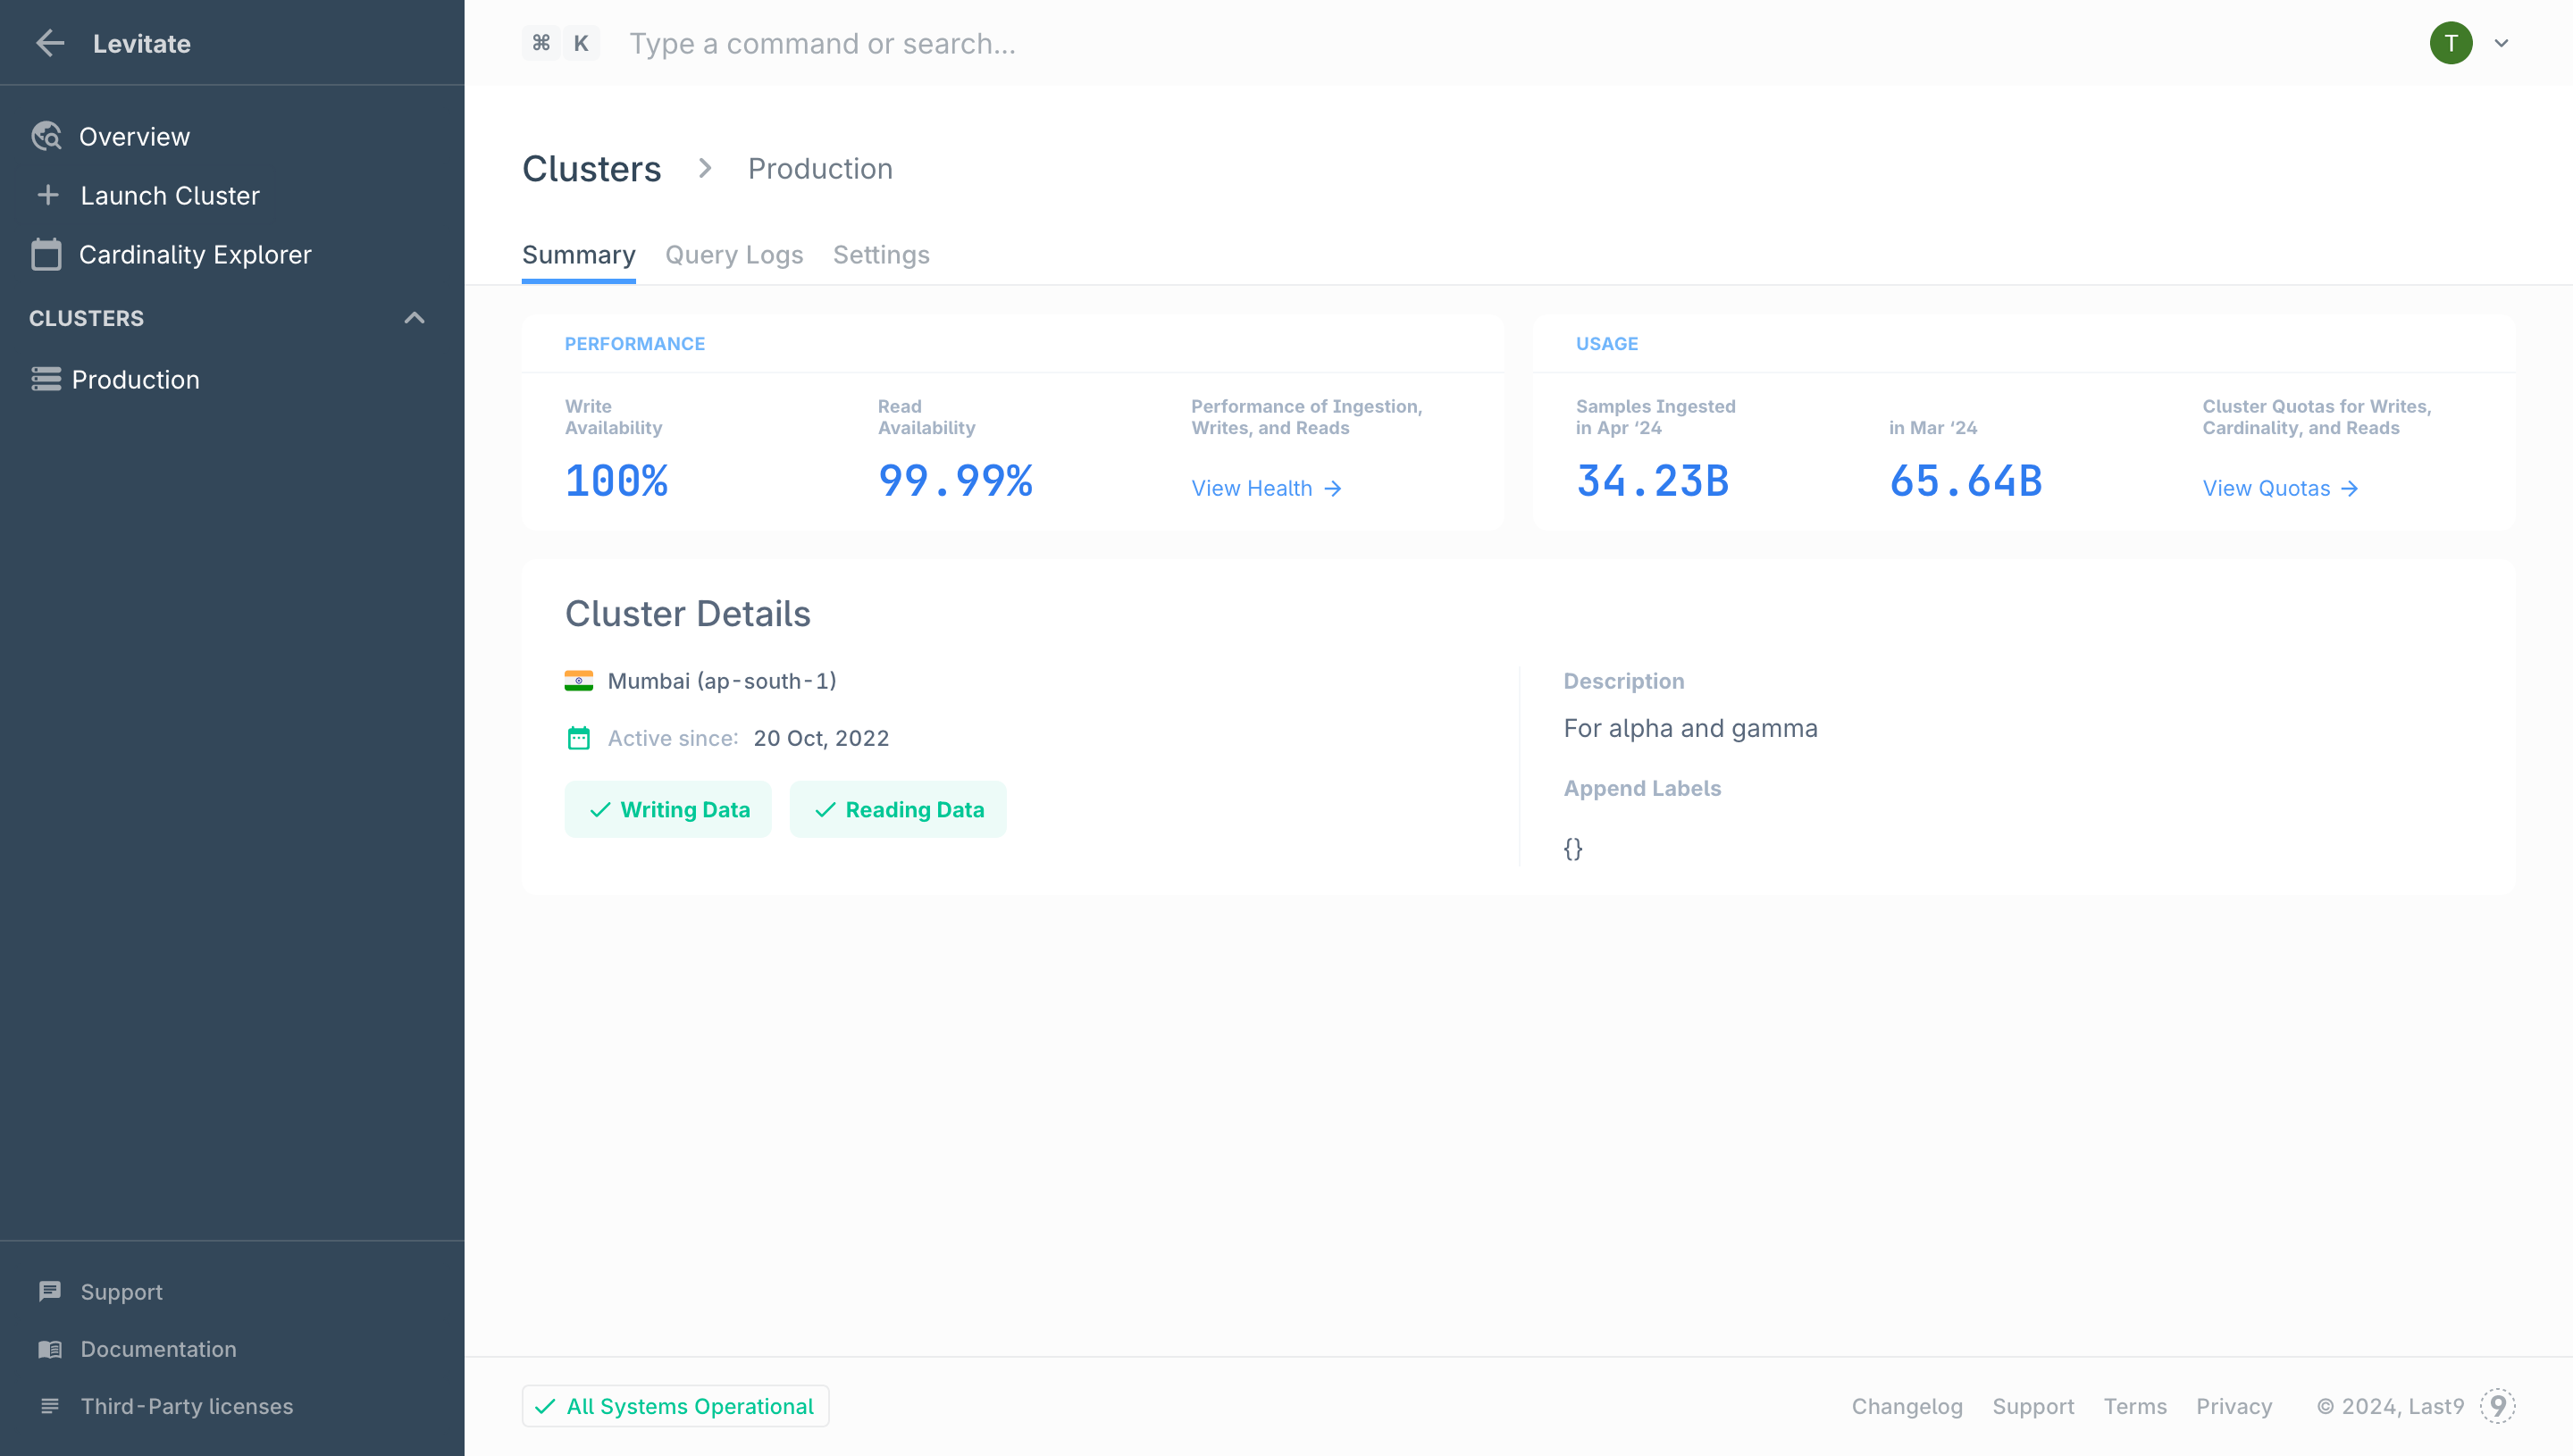
Cluster Usage
 Usage for each cluster is reported in Samples Ingested. A sample refers to a single data point in a time series.
Usage for each Cluster can be viewed from the Cluster’s details page. For more granular and historical usage, see the Cluster Health dashboard’s Sample Ingested panel.
Cluster Quotas
There are no per-cluster limits in Last9. You are billed for usage across all Clusters combined. The ingestion rate, read query rate, and data retention quotas are applied for all the data across all clusters.
Default Cluster Quotas
Last9’s default cluster quotas are fairly generous. In certain cases, keeping in mind performance and cost impacts, we may be able to increase a quota after a discussion with your team.
Write Quotas
| Type | Base Quota | Reset Period | Note |
|---|---|---|---|
| Per Time Series Cardinality | 1M | Per Hour | Can be raised on request |
| Per Time Series Cardinality | 20M | Per Day | Can be raised on request |
| Streaming Aggregation Cardinality | 3M | Per Hour | Can be raised on request |
| Ingestion Concurrency | 20K | Per Second | Can be raised on request |
| Number of Metrics Aggregated in one Pipeline | 1 Metric | Per Query | Cannot be changed |
Read Quotas
| Type | Base Quota | Note |
|---|---|---|
| Time Series Scanned Per Query — Blaze Tier | 5M | Cannot be changed |
| Time Series Scanned Per Query — Hot Tier | 10M | Cannot be changed |
| Samples Scanned Per Query | 100M | Cannot be changed |
| Query Time Range — Blaze Tier | 2 Hours | Can be raised on request |
| Query Time Range — Hot Tier | 35 Days | Can be raised on request |
If you wish to change your quotas, please raise a request by emailing us on: cs@last9.io
Cluster Health Dashboard
Every Last9 Cluster comes with its own Health dashboard. To view the Health dashboard, navigate to the Cluster details page and click on the View Health link in the performance card.
The following Cluster Performance Metrics are available in the health dashboard:
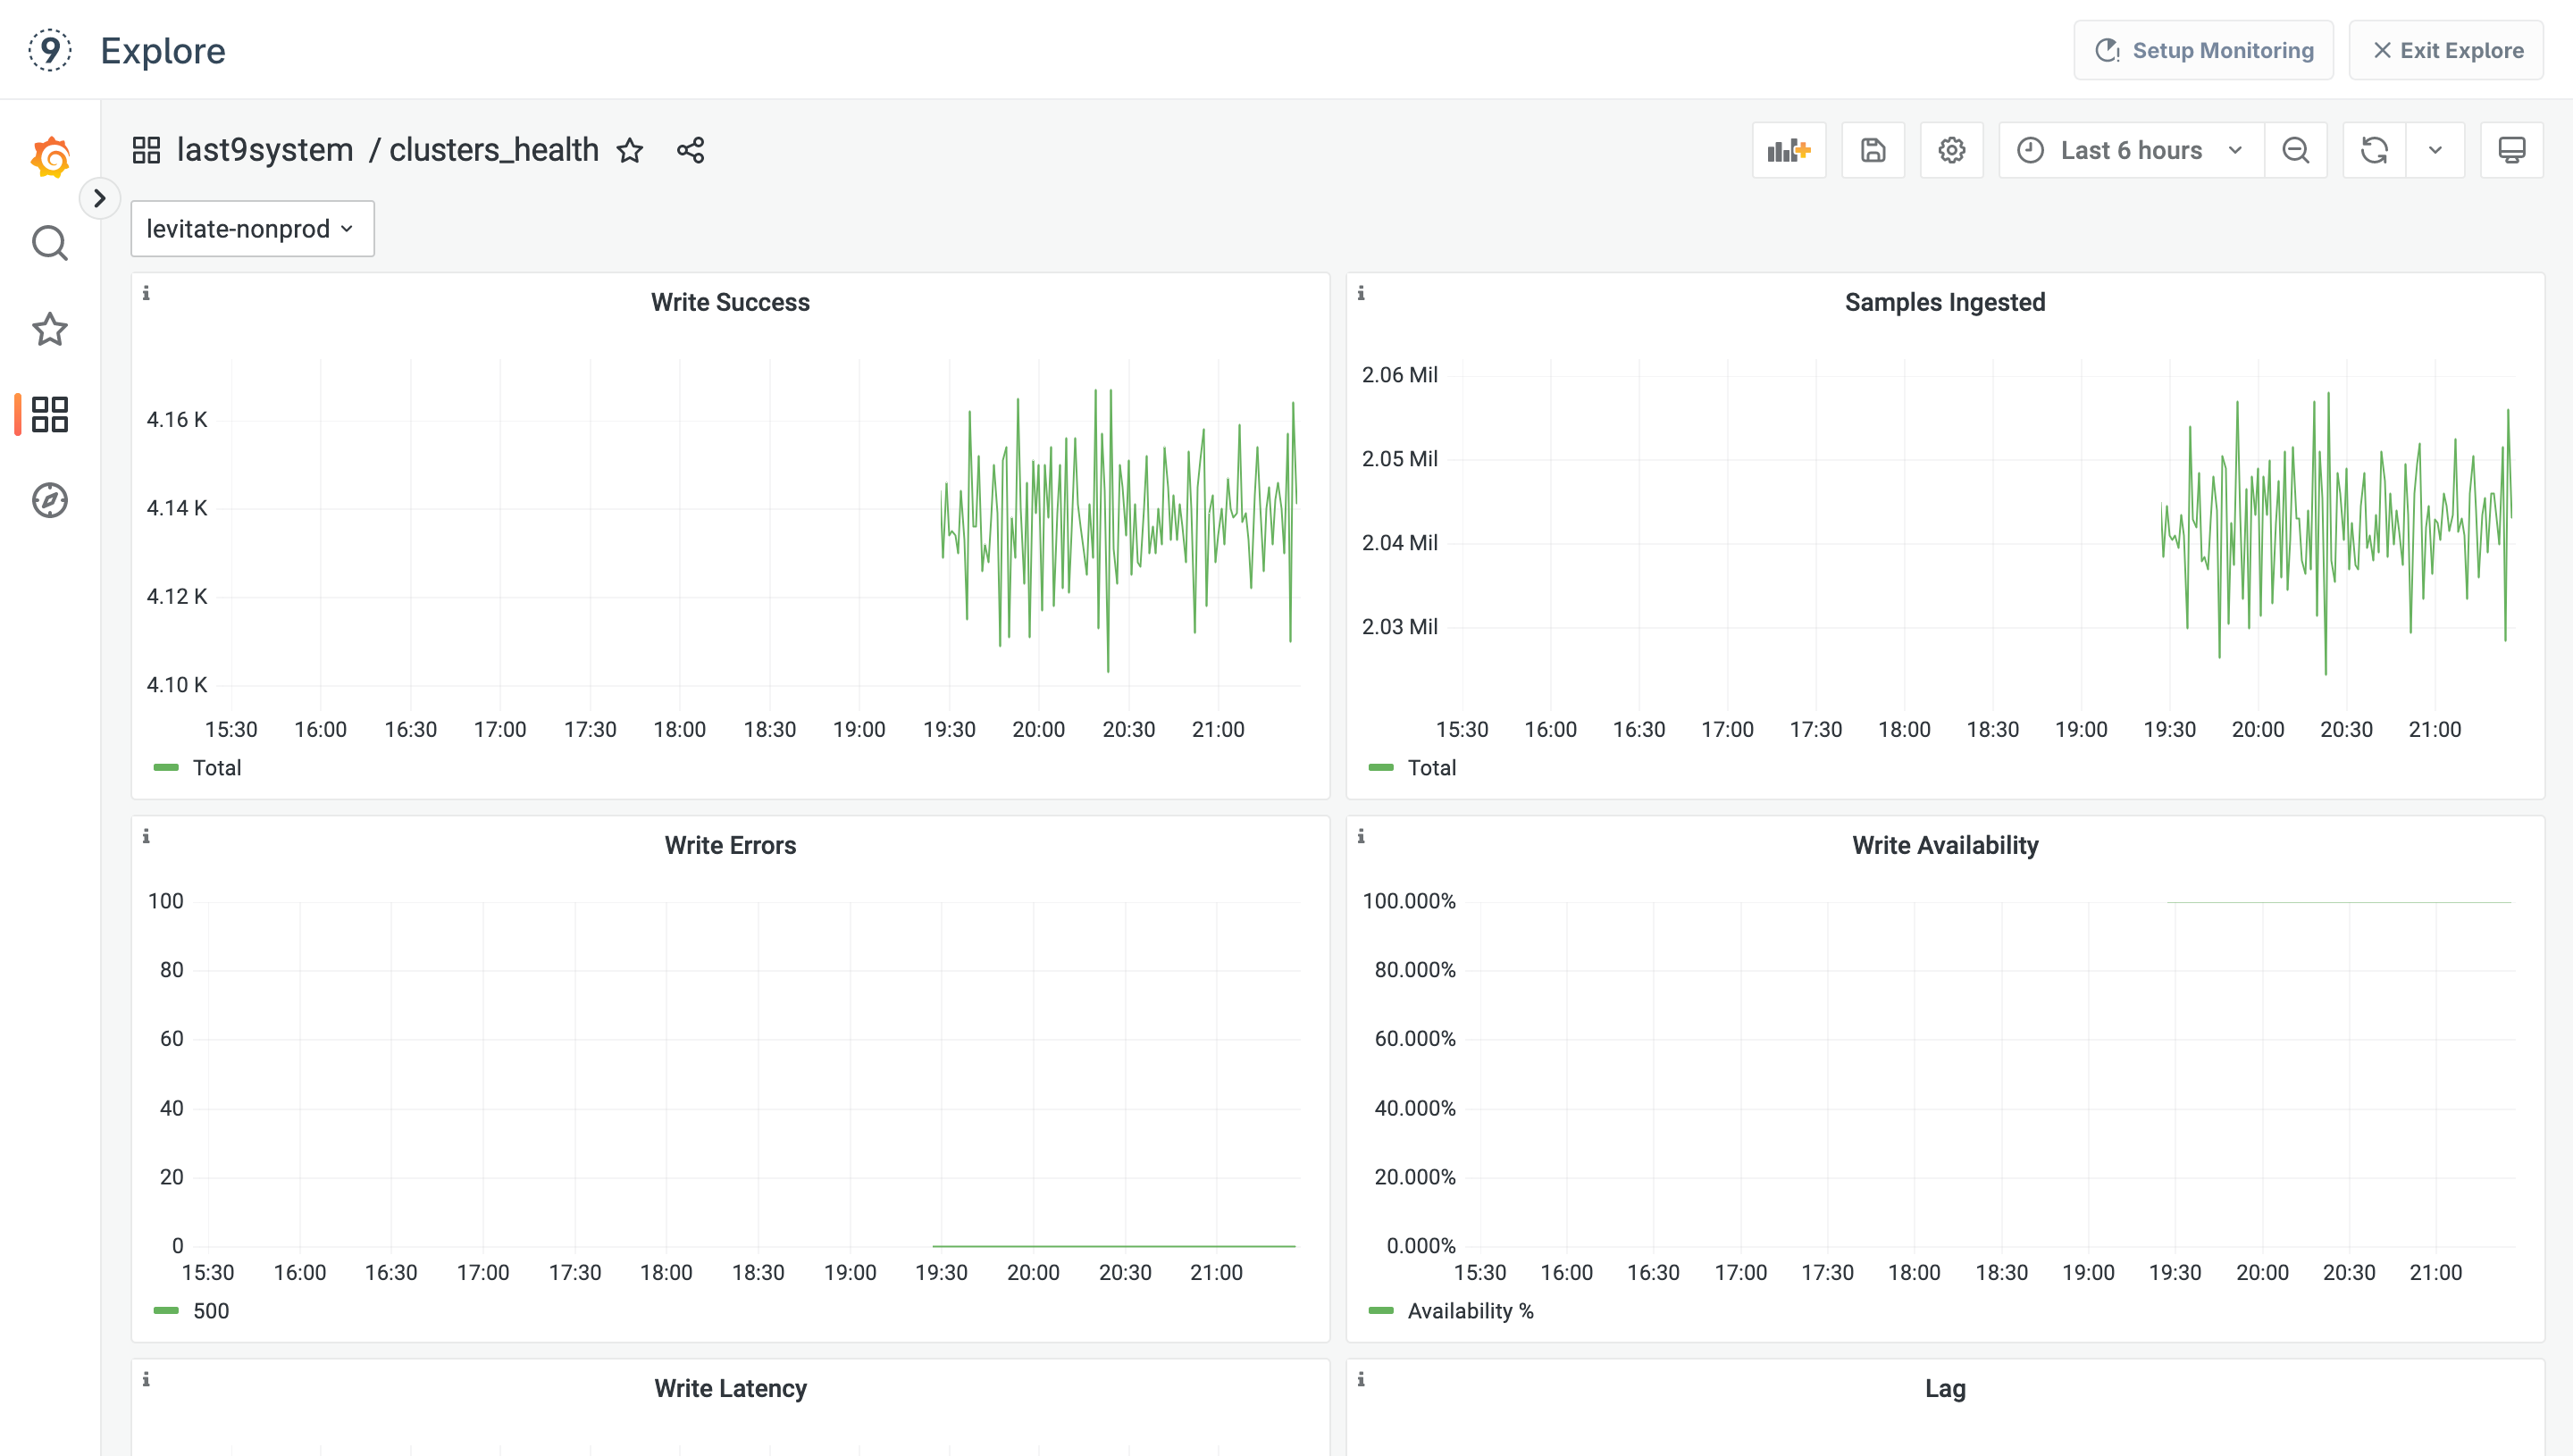
- Write Success - Total successful write requests
- Write Error - Total failed write requests
- Samples Ingested - Total number of samples ingested
- Write Availability - Percentage of write requests successful
- Write Latency - Write request latency
- Lag - Pending samples waiting to be indexed (in bytes)
- Read Success - Total successful write requests
- Read Errors - Total failed read requests
- Cardinality Limited - Metrics whose cardinality has been limited
- Read Latency - Query Latency
- Cardinality Limiter (Early Warning) - Metrics whose cardinality is about to be limited
- Bytes Dropped - Samples permanently failed to be indexed (in bytes)
Query Logs
Query Logs helps identify slow-running queries so that you can debug and optimize your PromQL.
Query Logs displays slow queries in the last 24 hours, which were successfully executed but have taken more than 1000ms (ie one second) to execute.
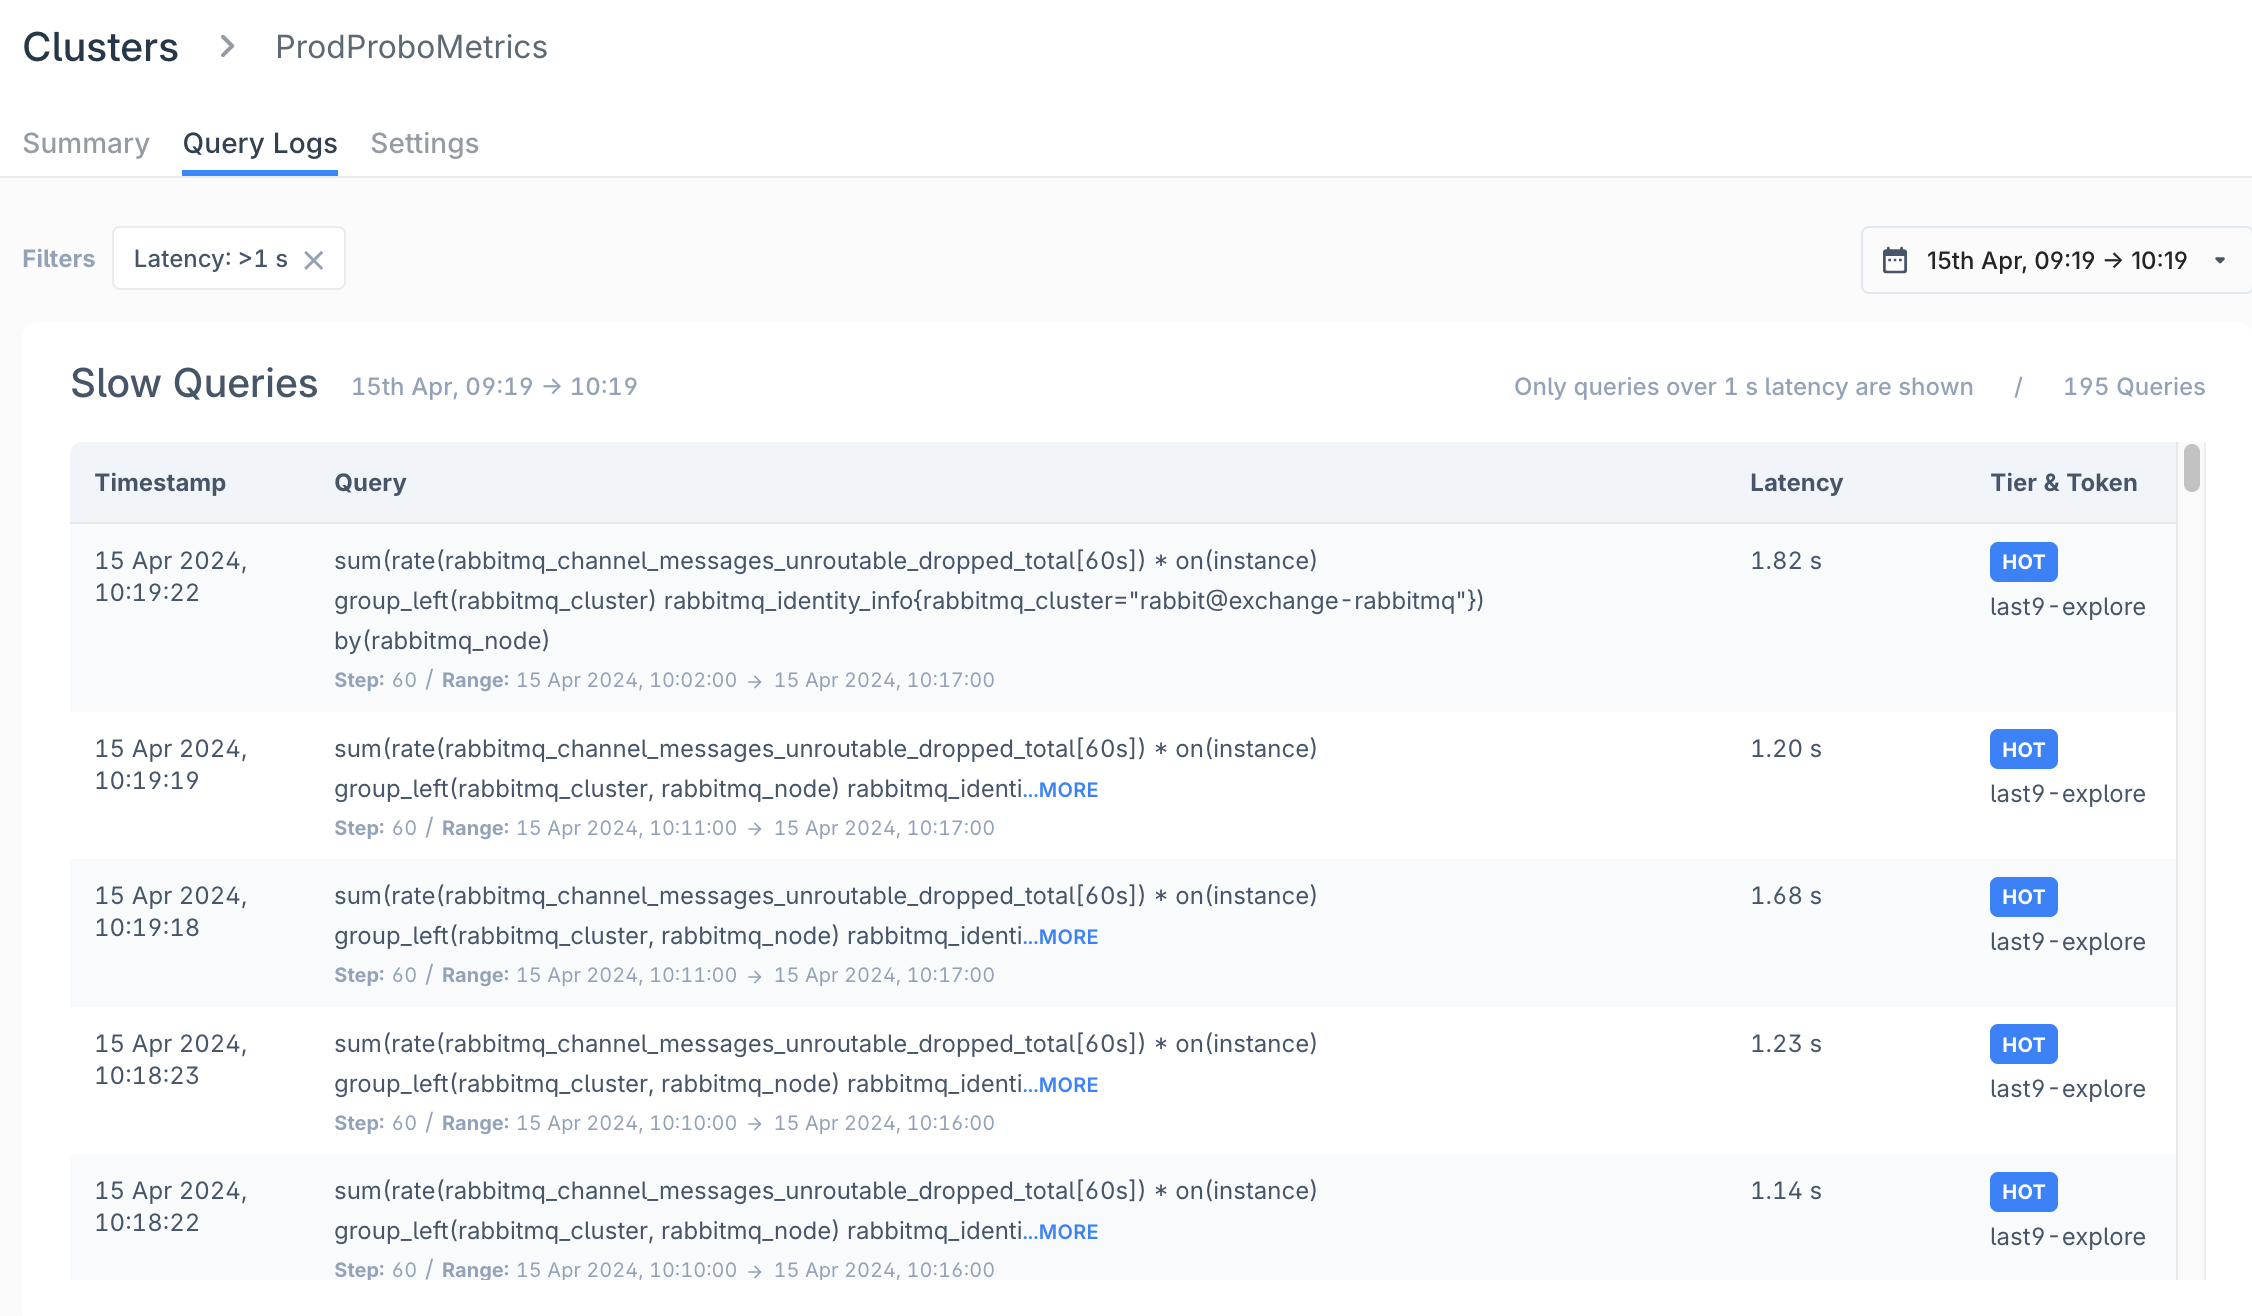
When a slow query is identified the following details are displayed:
- Timestamp - Time when the query was executed
- Query - PromQL along with the query’s time range and query resolution step width
- Latency - approximate time taken for the query to execute
- Token Name - the name of the token used to query
- Tier - storage tier that was used for this query
Cluster Settings
Tokens
Tokens provide a mechanism for access management for your clients. We generate a default token when the Cluster is created for the first time
Creating a New Token
- Navigate to the Cluster that you wish to create a token for: Control Plane → Tokens
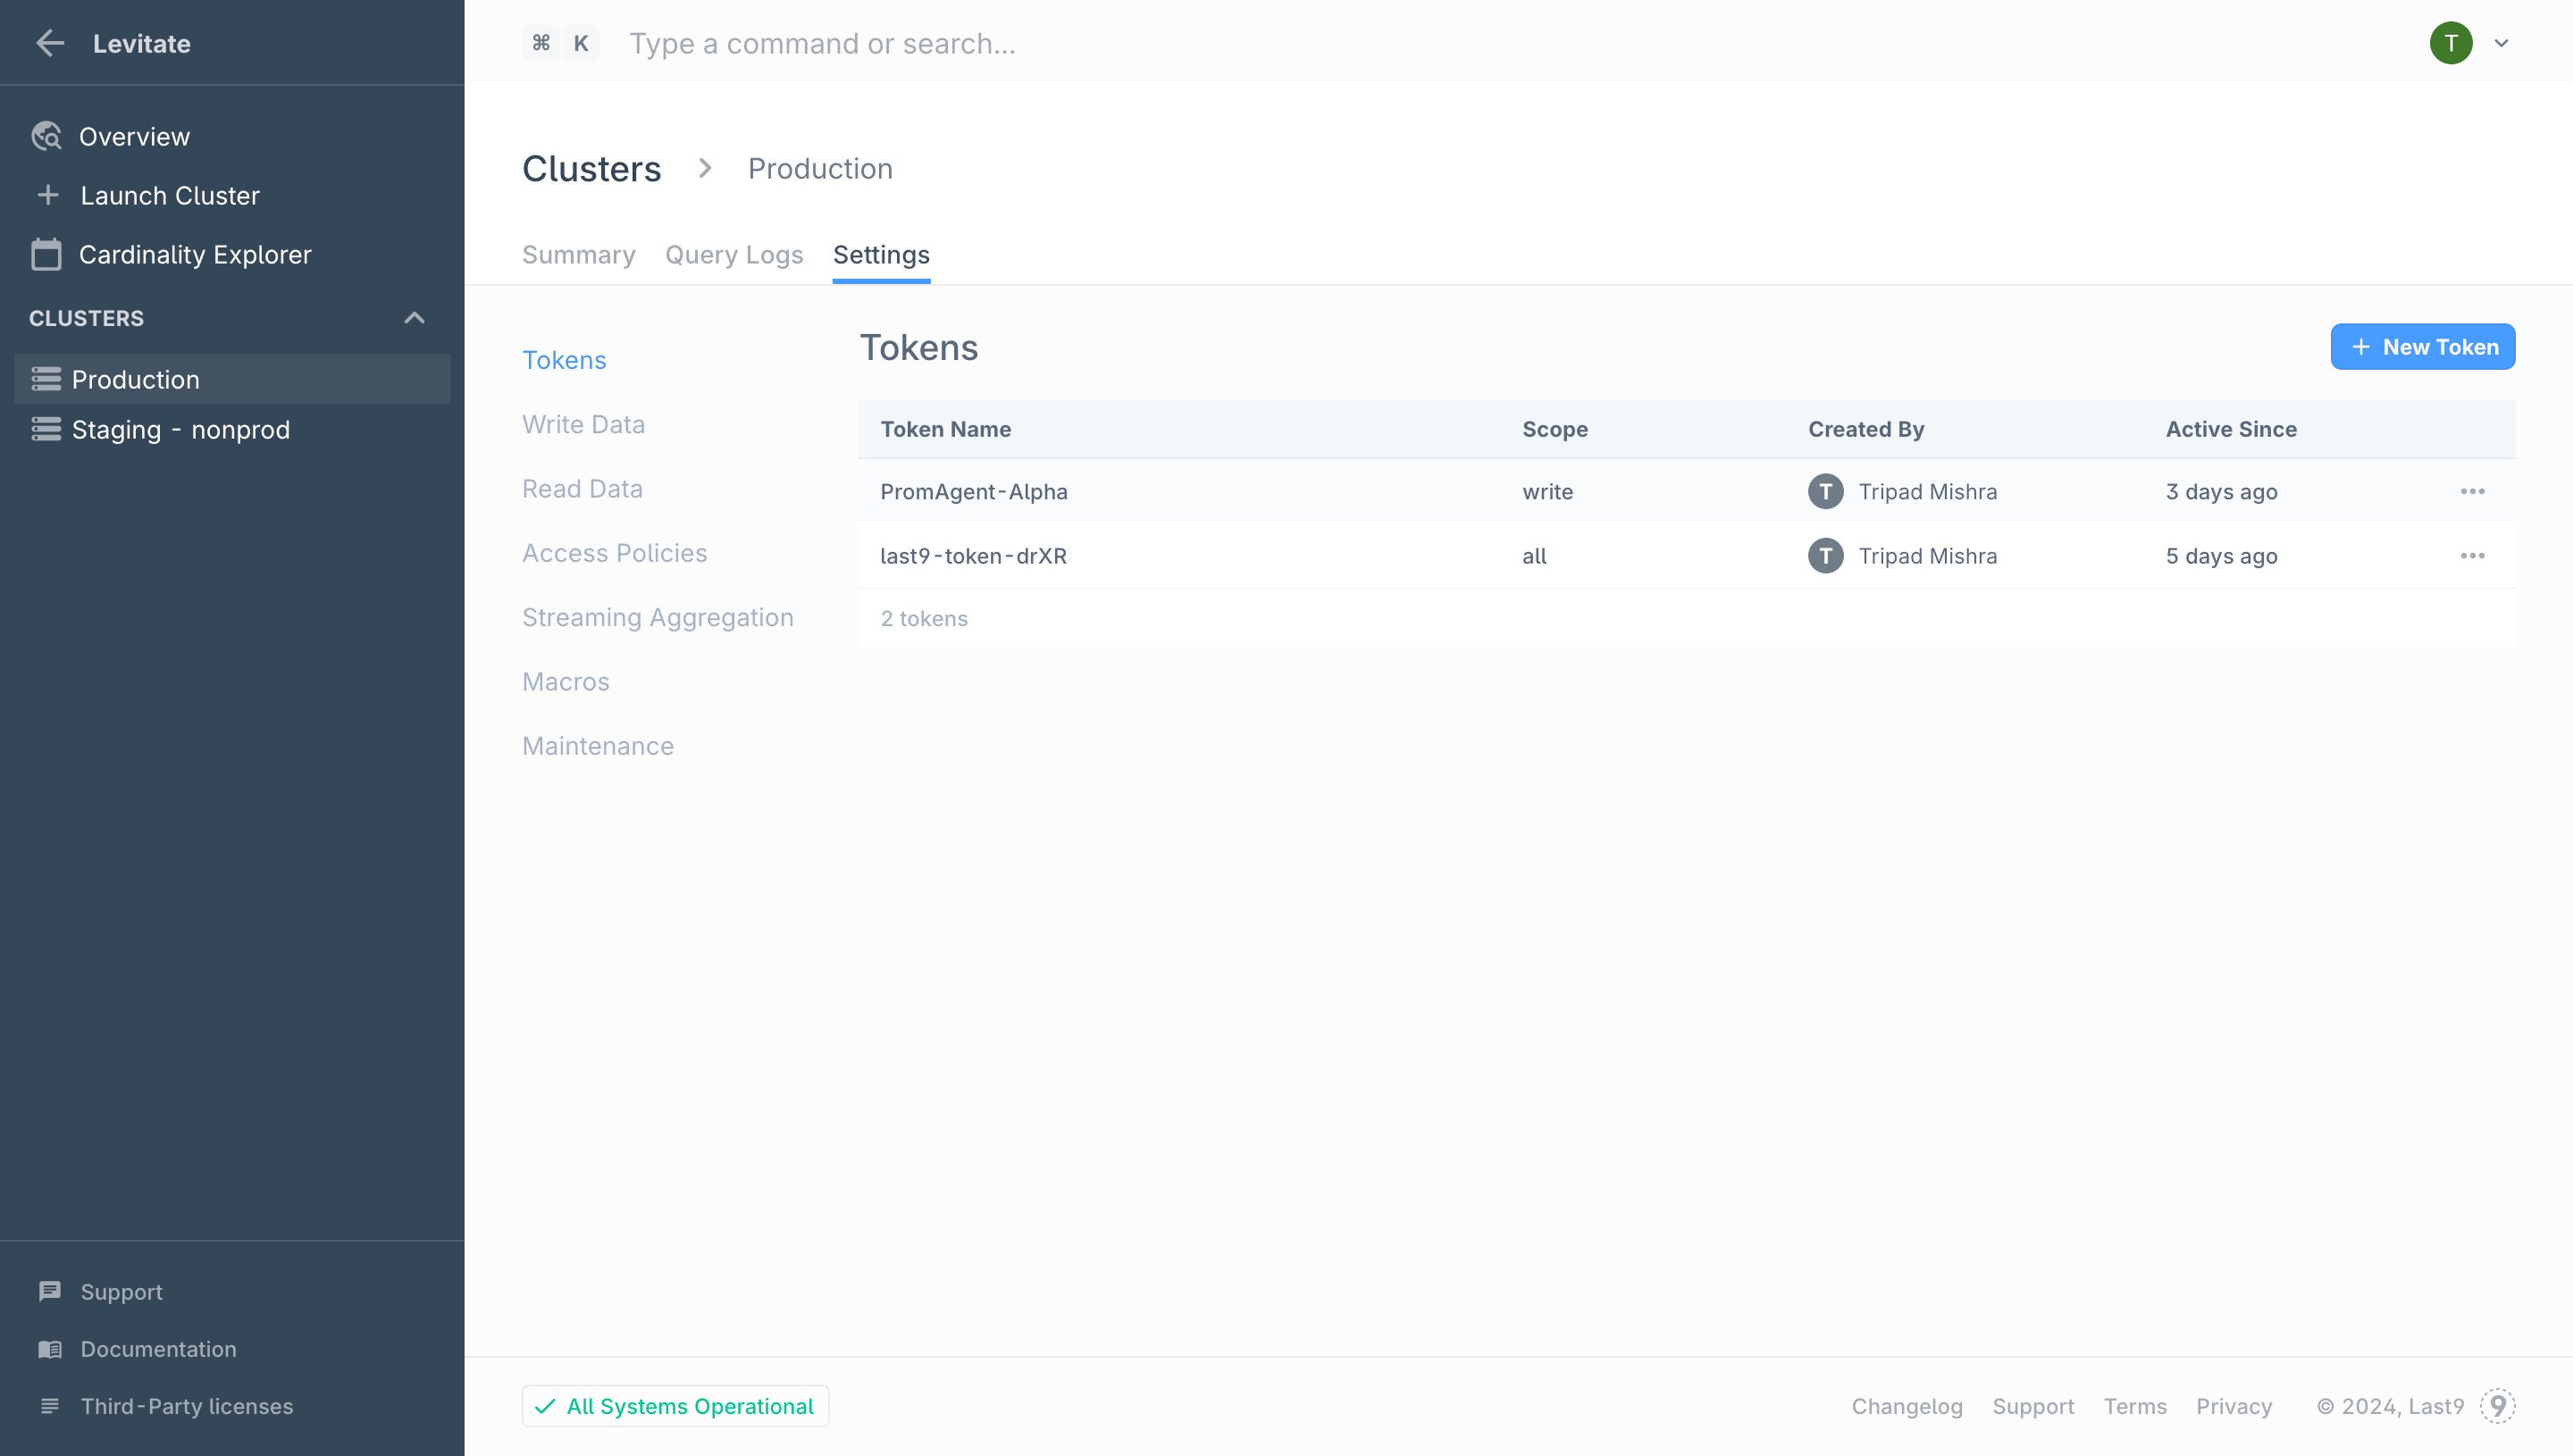
- Click New Token
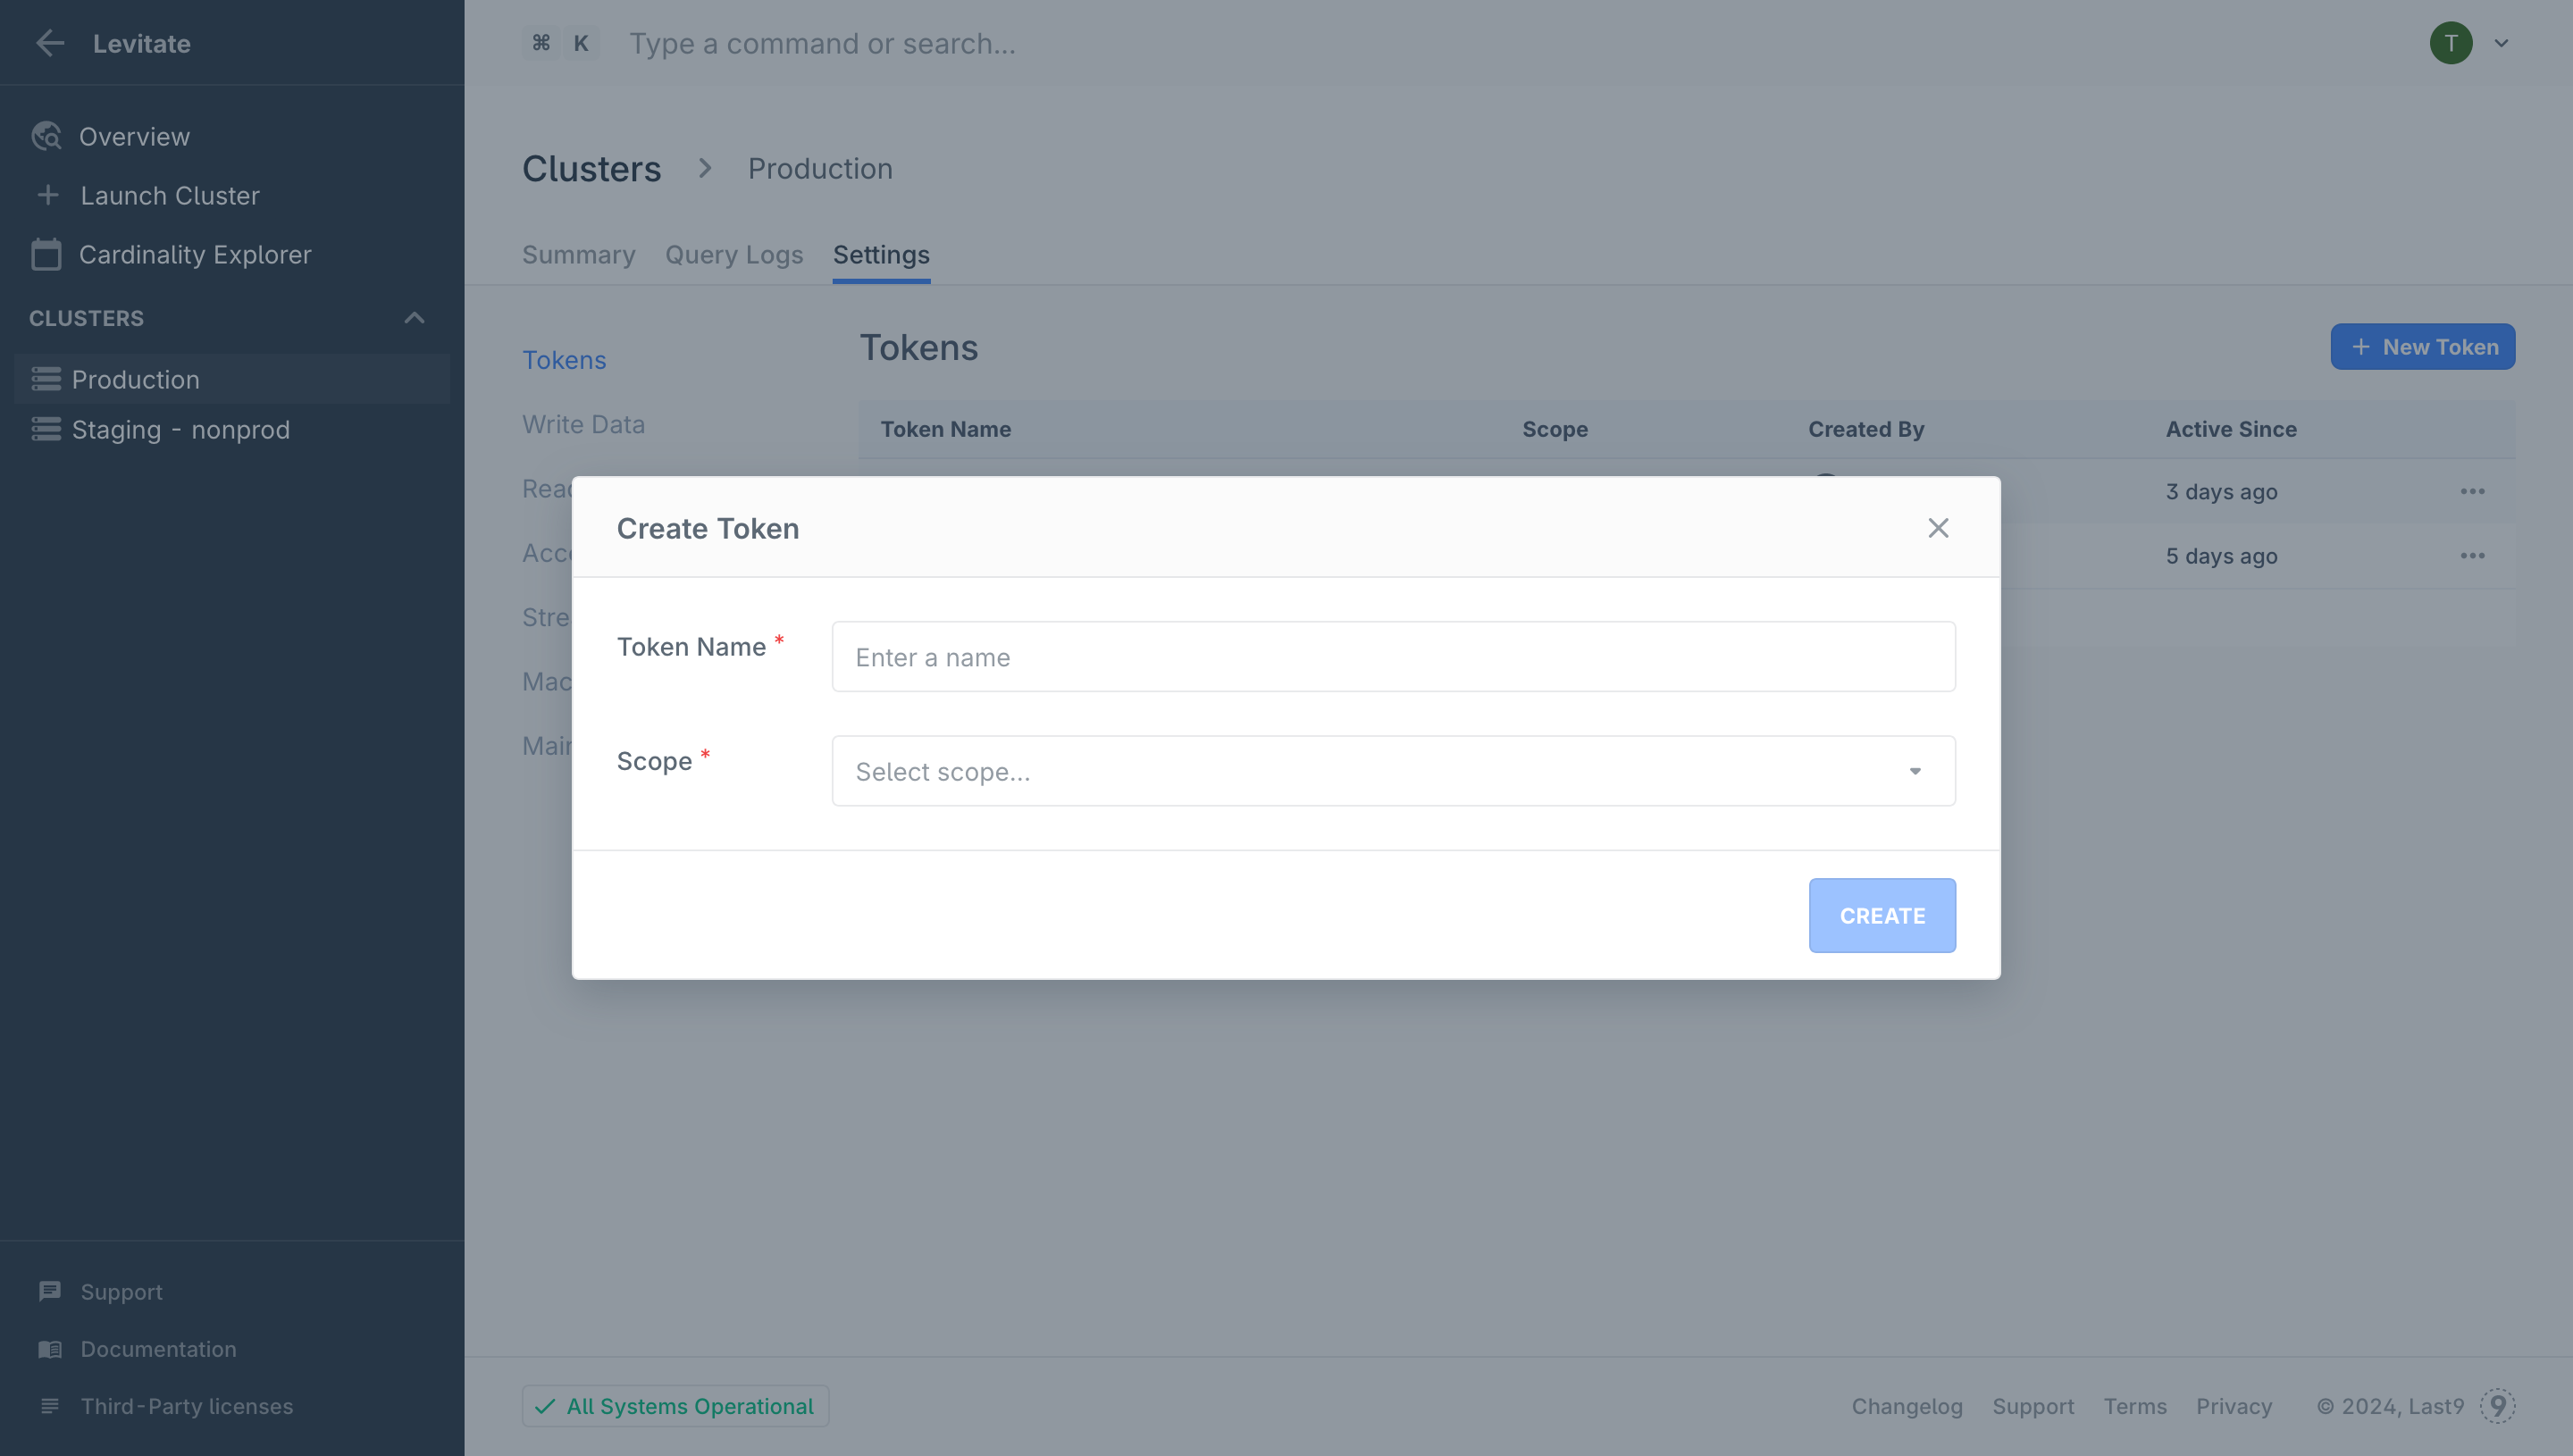
- Provide a descriptive Token Name the access Scope (Write Only, Read Only, Read & Write) and click Create
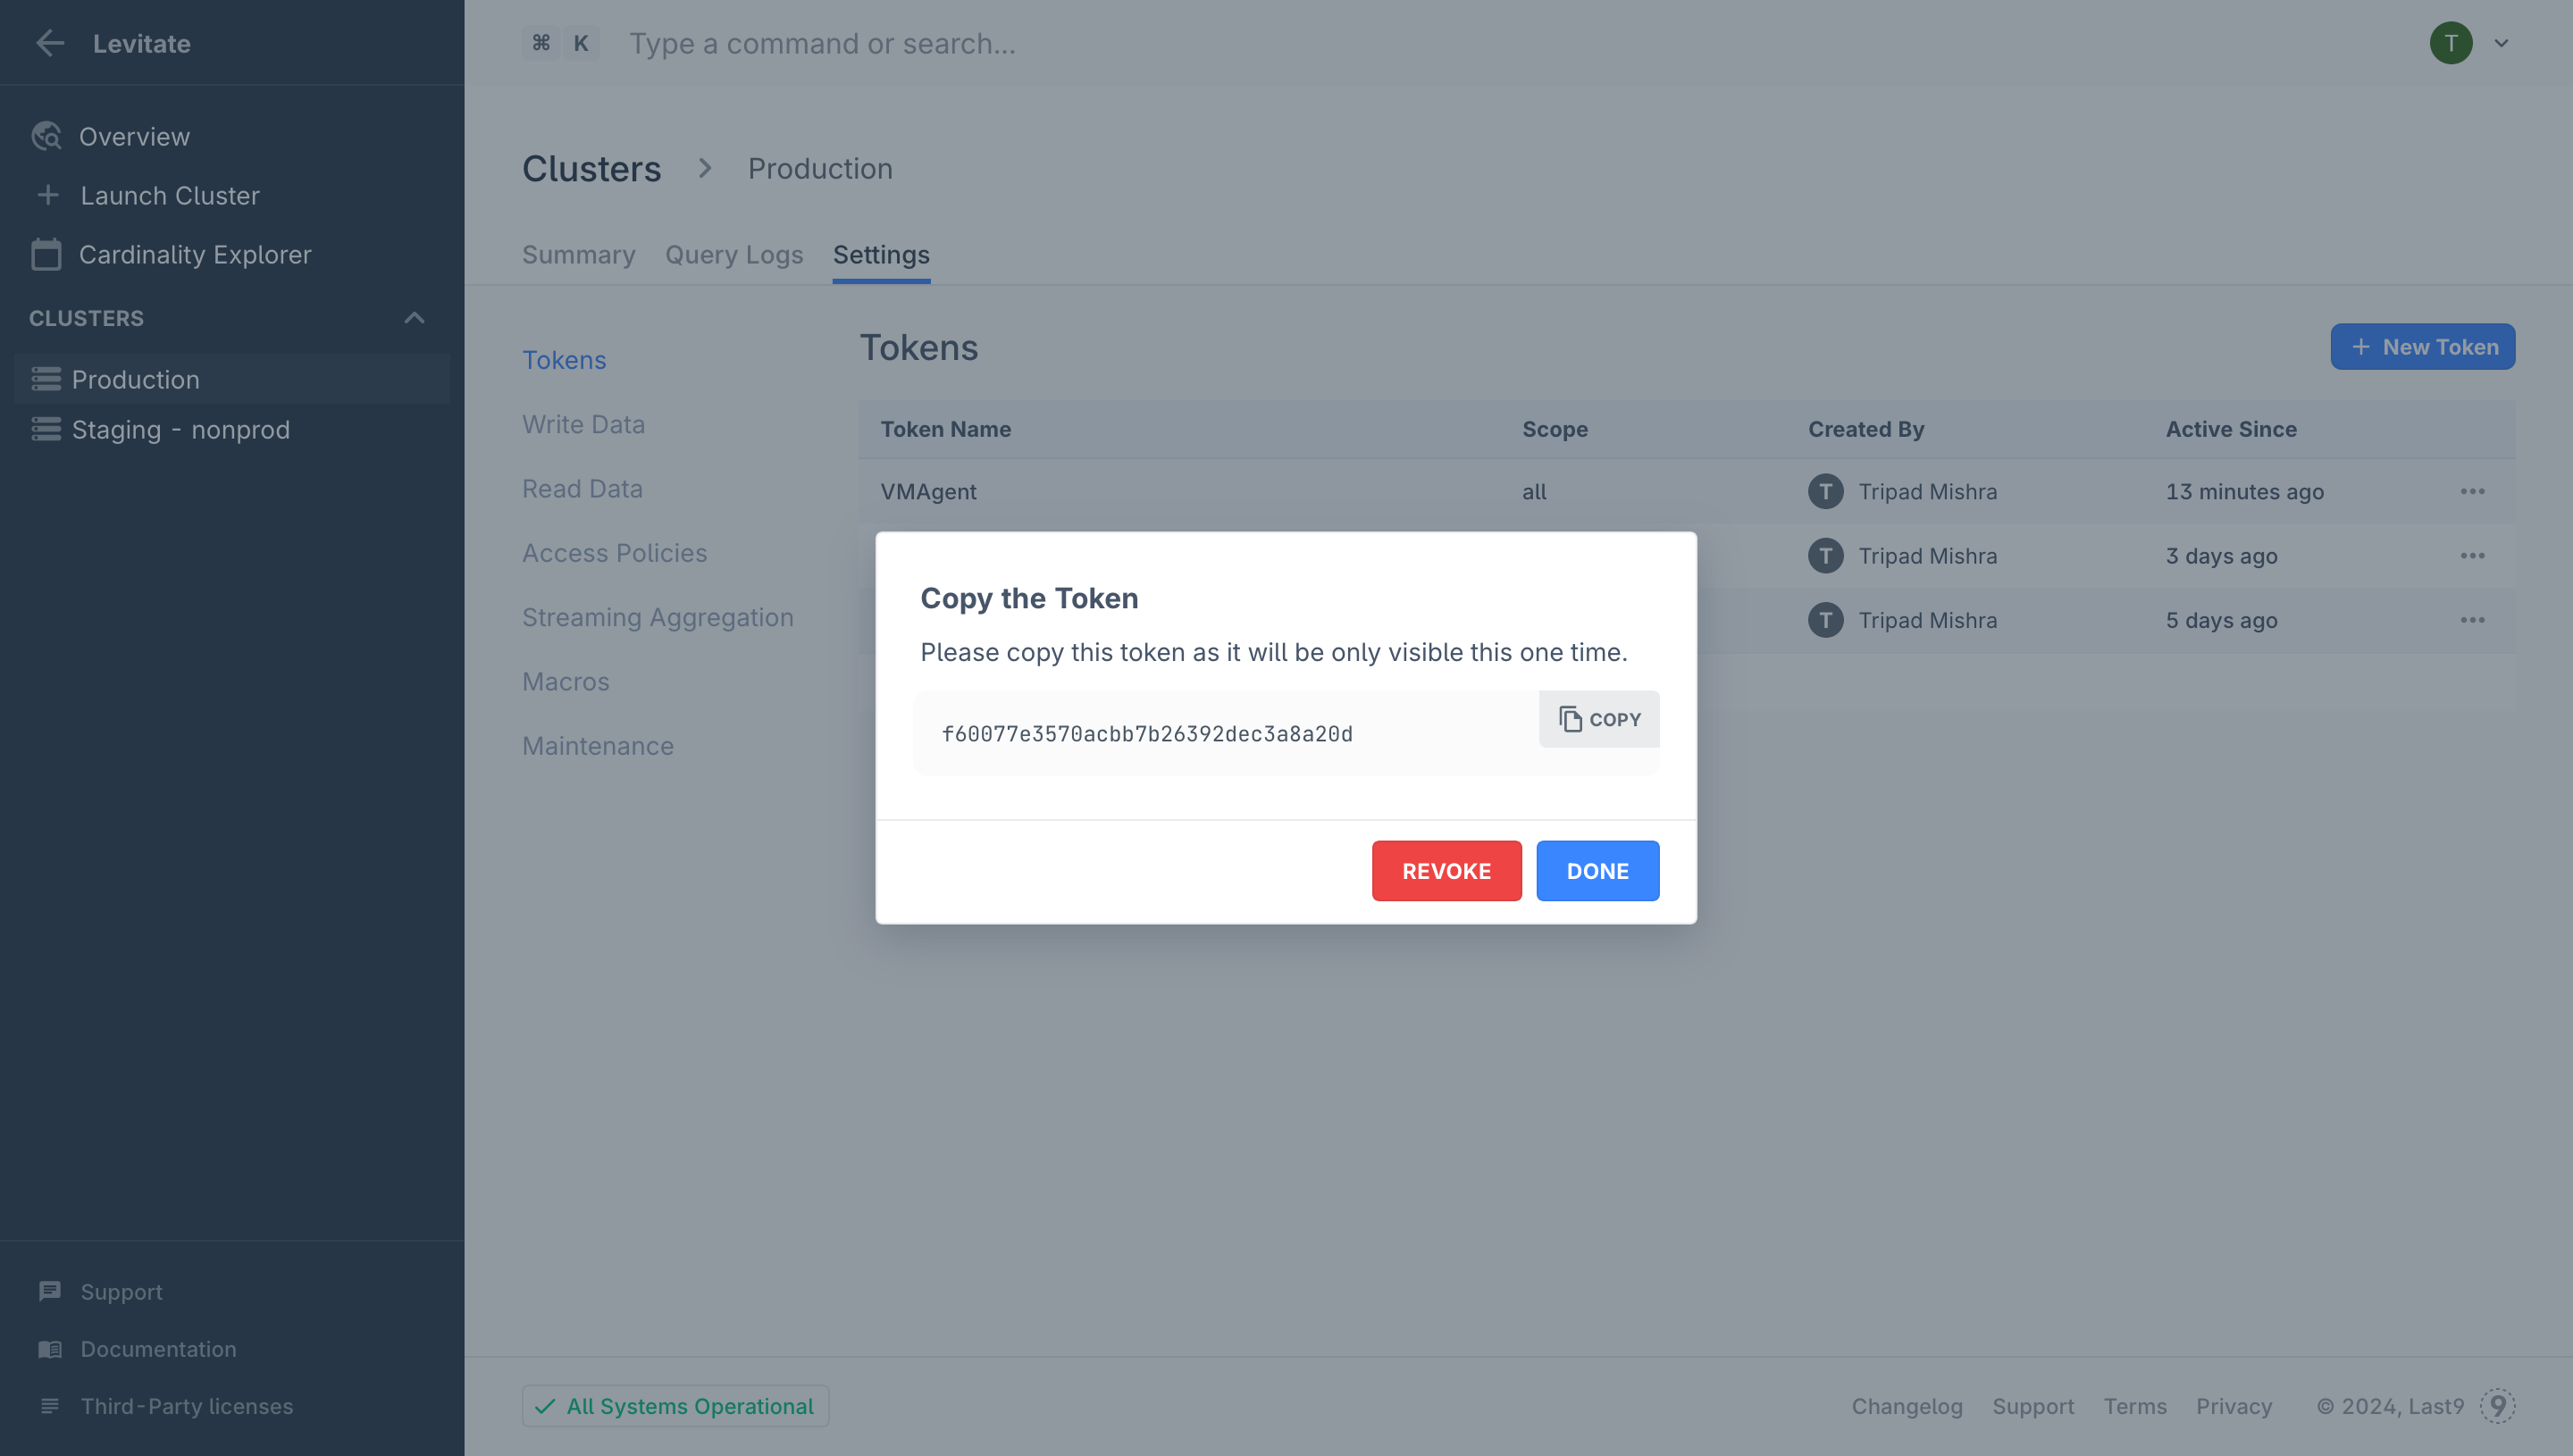
- Copy the generated token since it will be visible only once. This token can now be used along with the Read or Write URL (depending on the Scope selected)
Delete a Token
To delete/revoke a token:
- Navigate to the Cluster that you wish to revoke a token from: **Control Plane → Tokens
- Click the … button and select Delete
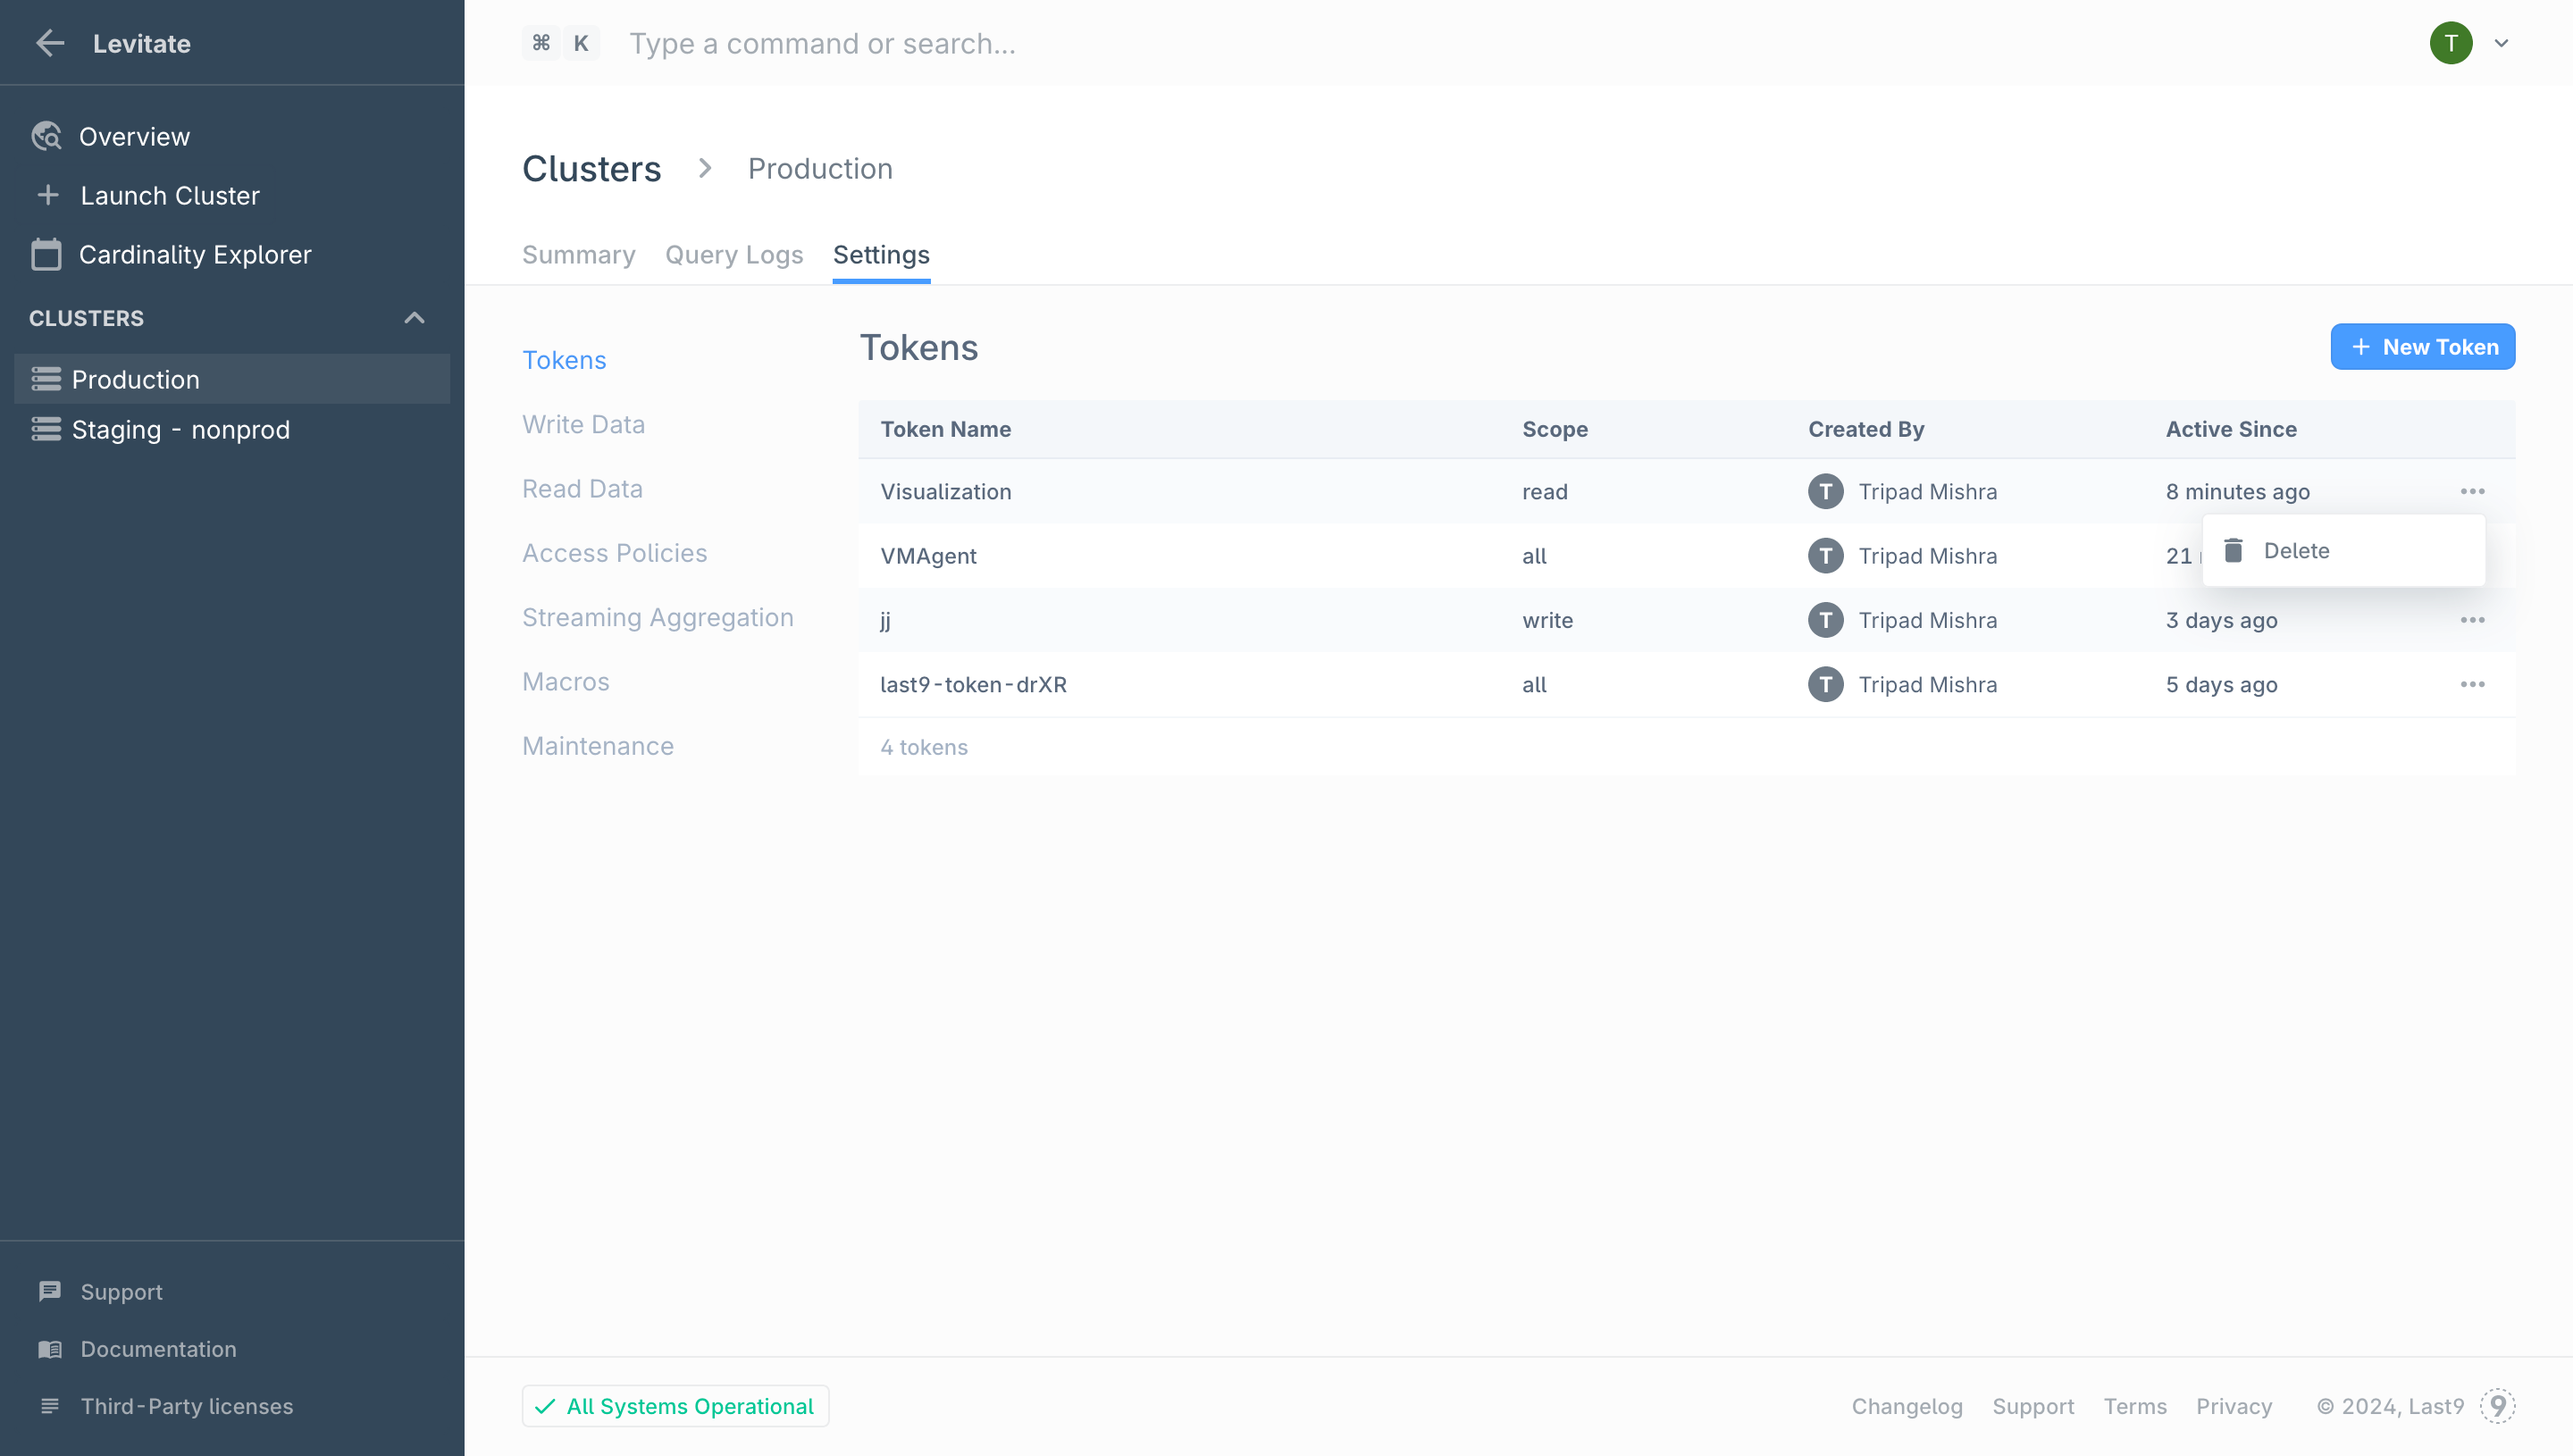
Note:
- This action cannot be undone, once deleted tokens cannot be recovered
- Tokens can only be deleted by your organization's admin
Write & Read Data
Refer to the list of available Integrations that can be used to start writing and reading data to a Last9 Cluster.
Access Policies
Last9 has built-in data-tiering capabilities based on retention policies. Access policies let you define policies to control which token or client can query a specified data tier.
See our in-depth guide on how you can leverage this powerful feature - Guide on Access Policies
To define a new access policy:
-
Navigate to Control Plane → Access Policies
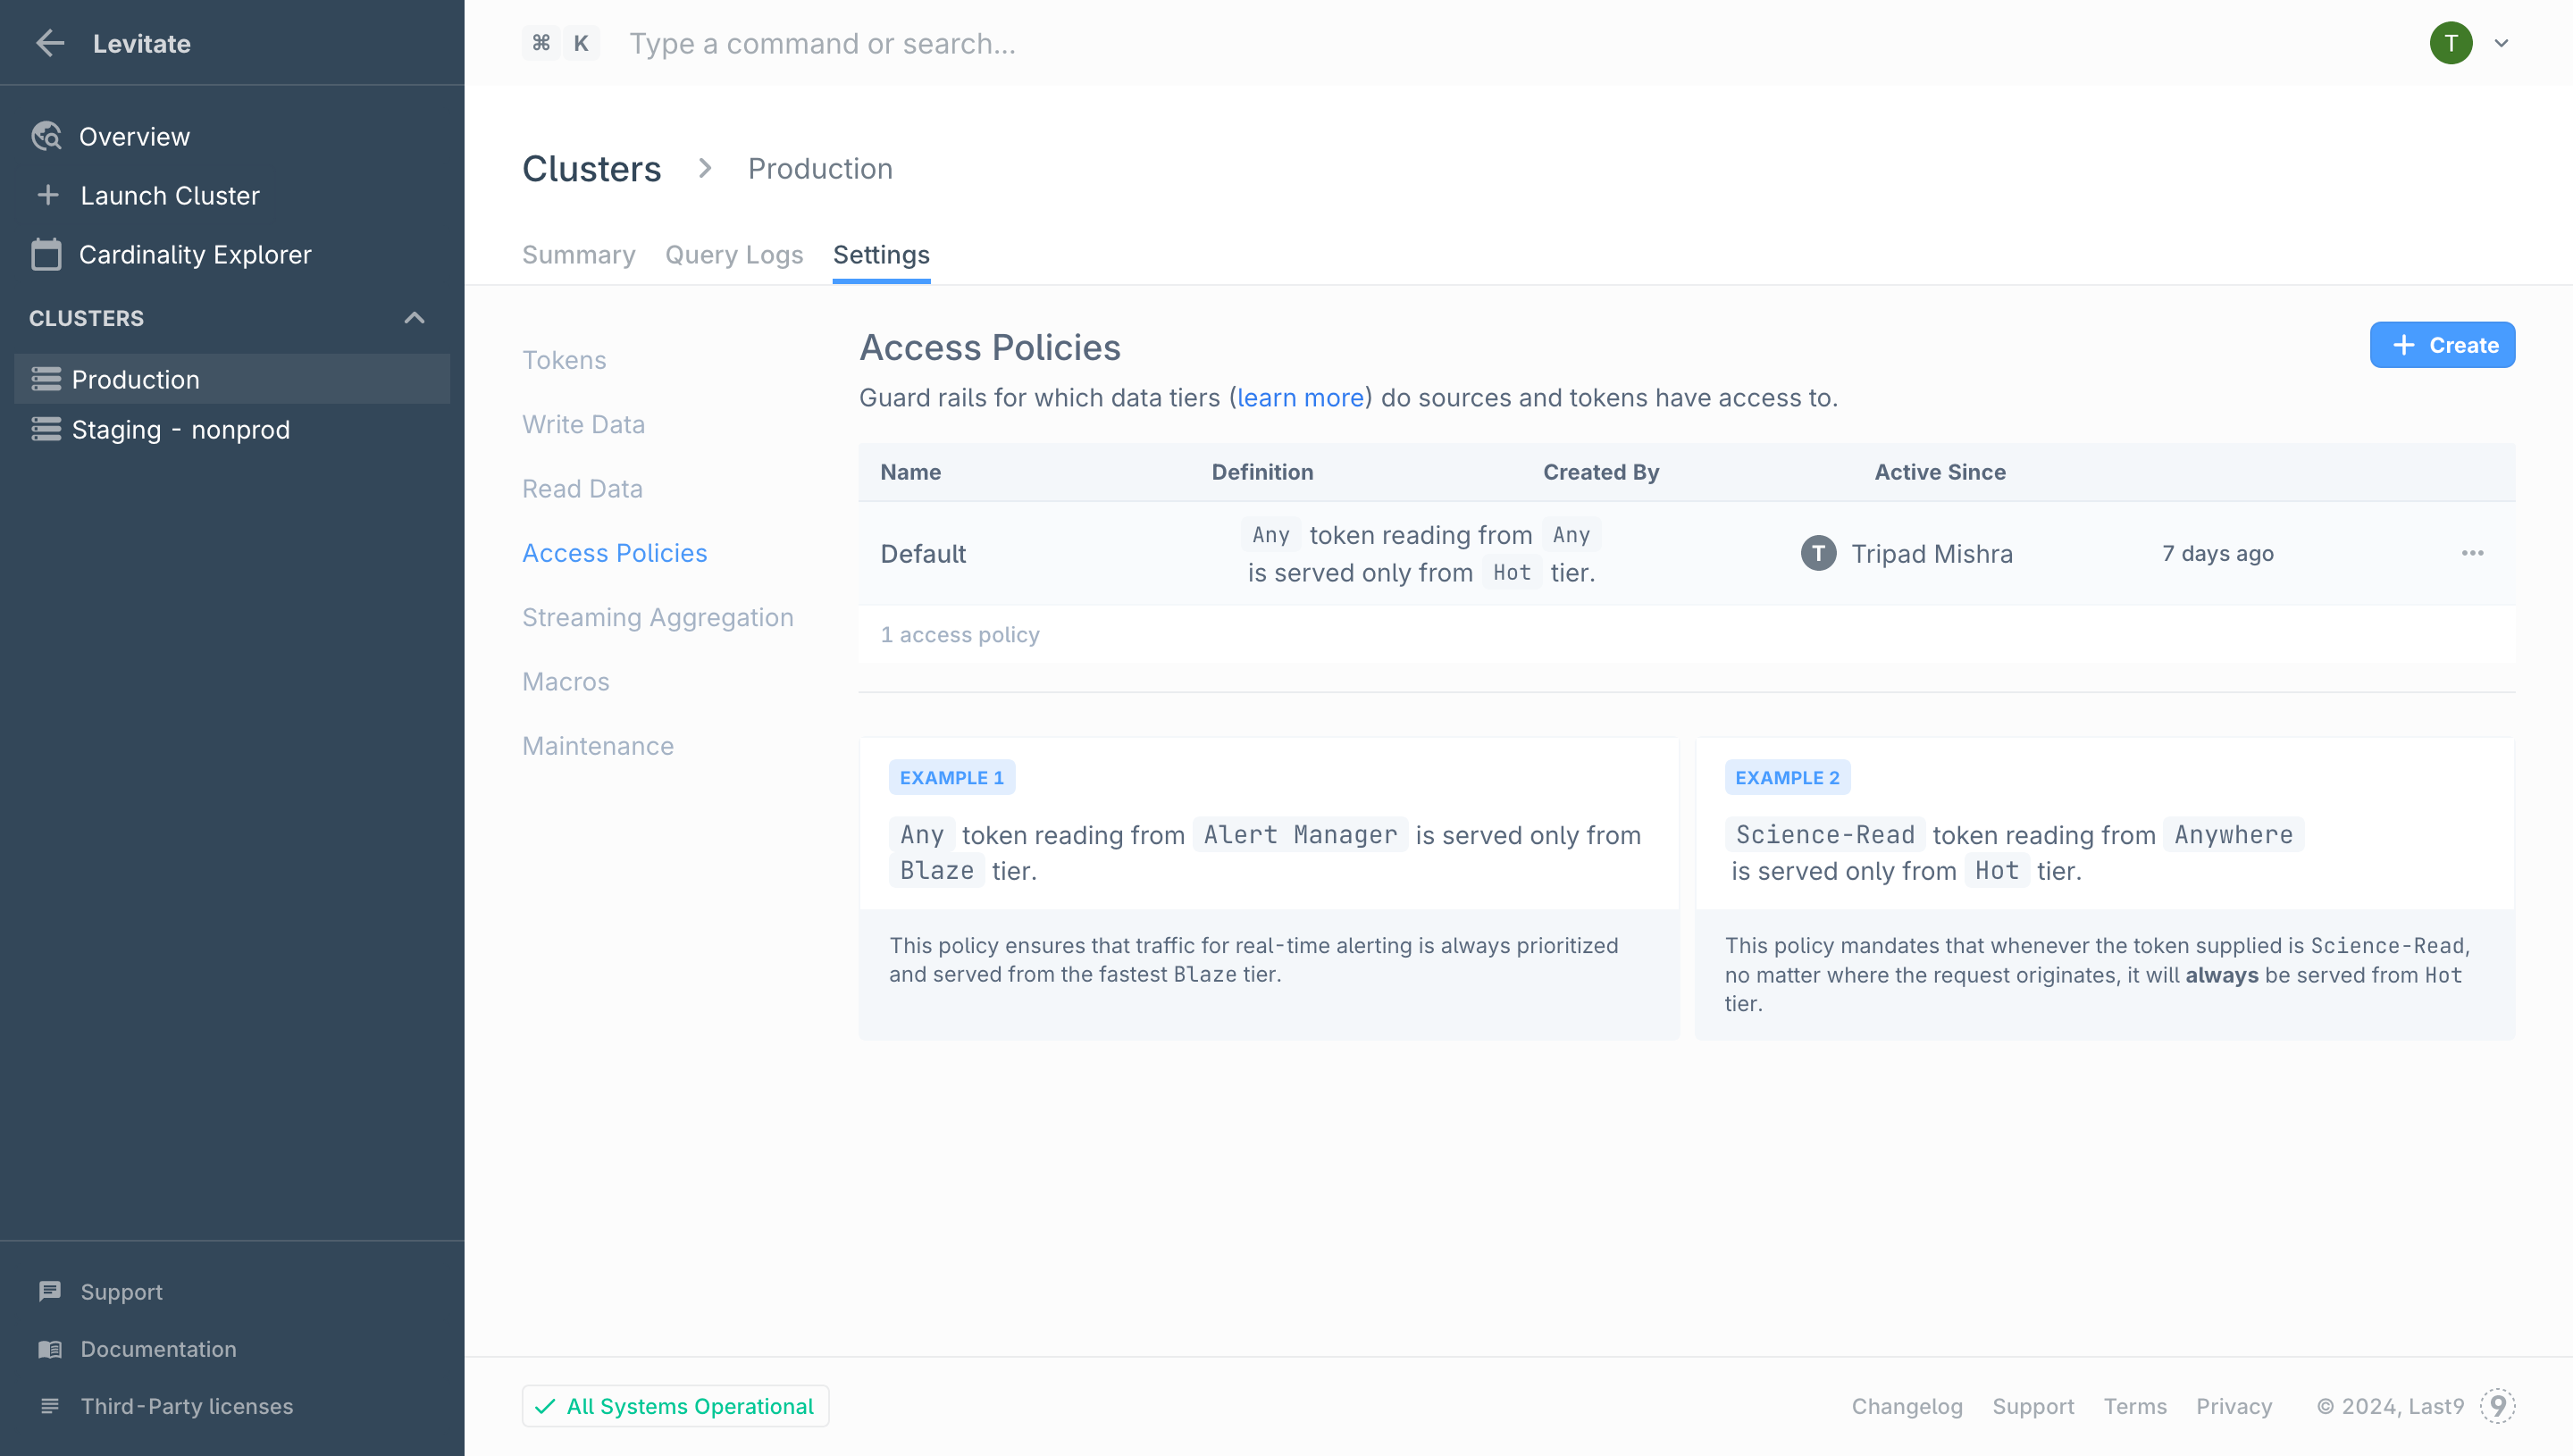 Every cluster comes with a default access policy pre-configured.
 -
To define a new policy click the Create button
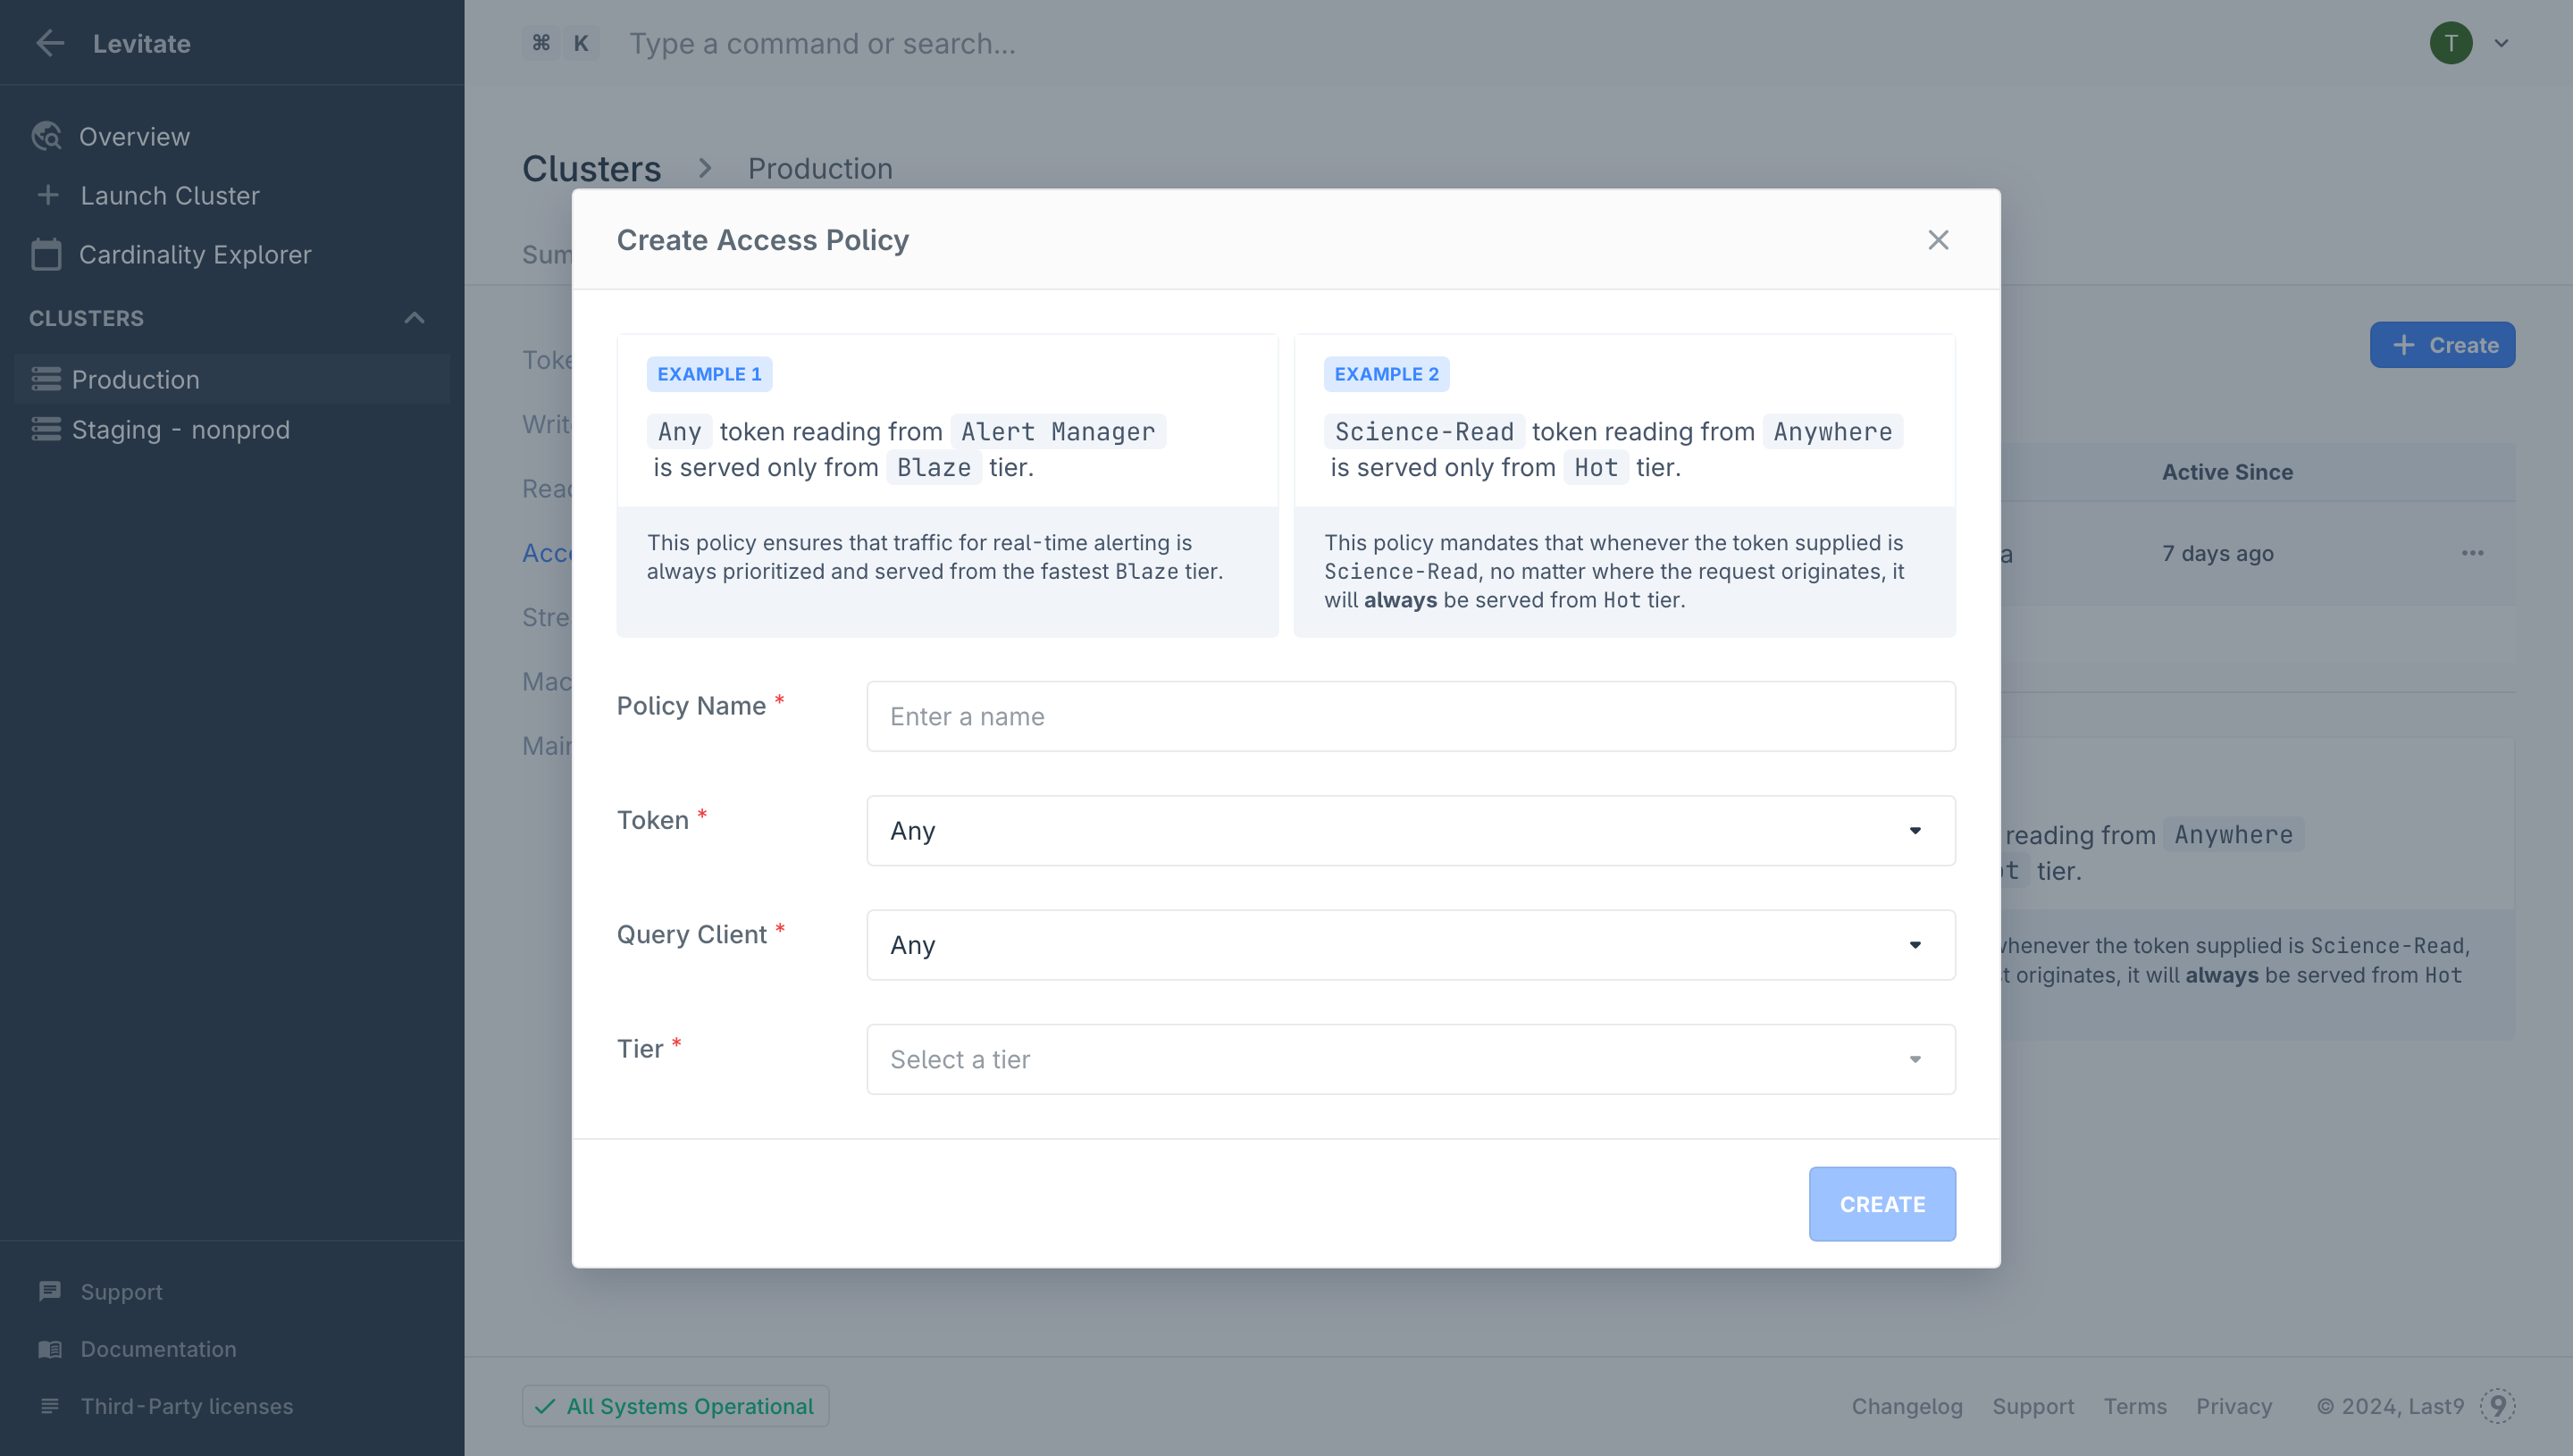 Provide the following details:
- Policy Name: Give a descriptive name for this access policy
- Token: Select a specific Token for which this access policy is applied or select Any
- Query Client: We can identify traffic from known clients or select Any for the policy to apply from any client
- Tier: Select the Tier from which the queries will be served for this policy
And click Create
-
Your new access policy will be applied instantly
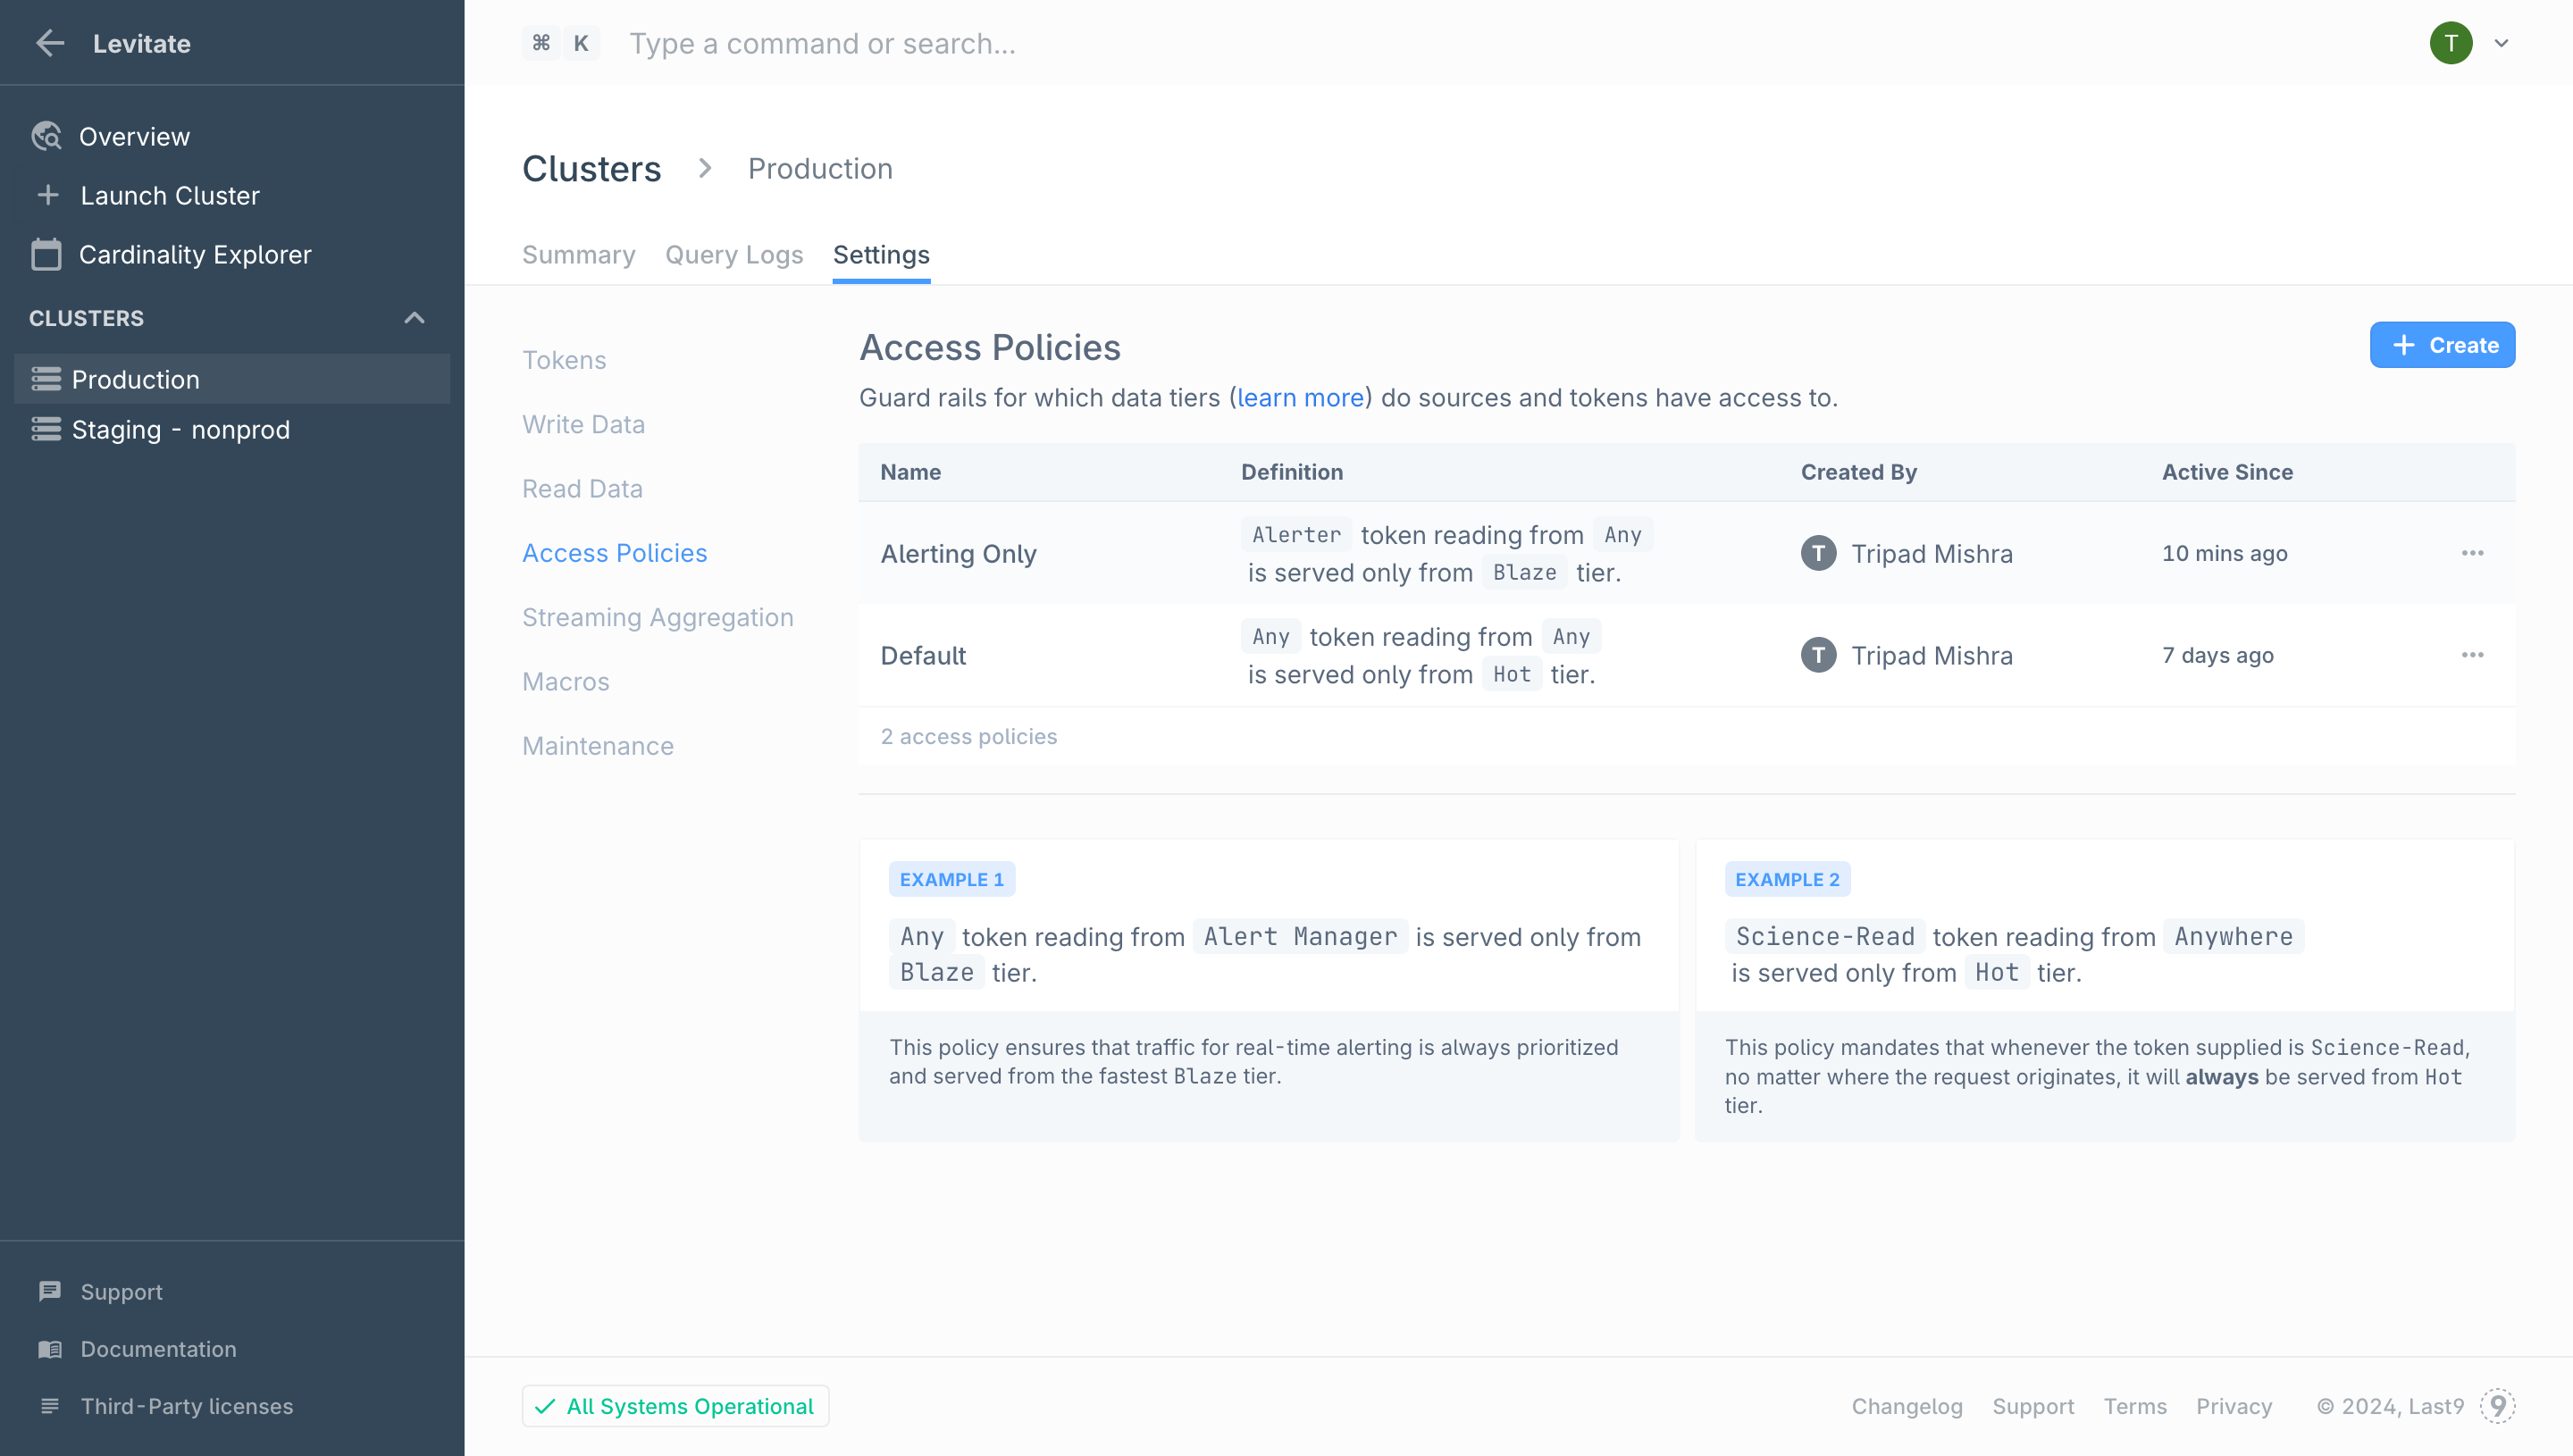
To delete an Access Policy :
- Select the … button beside the access policy you wish to delete
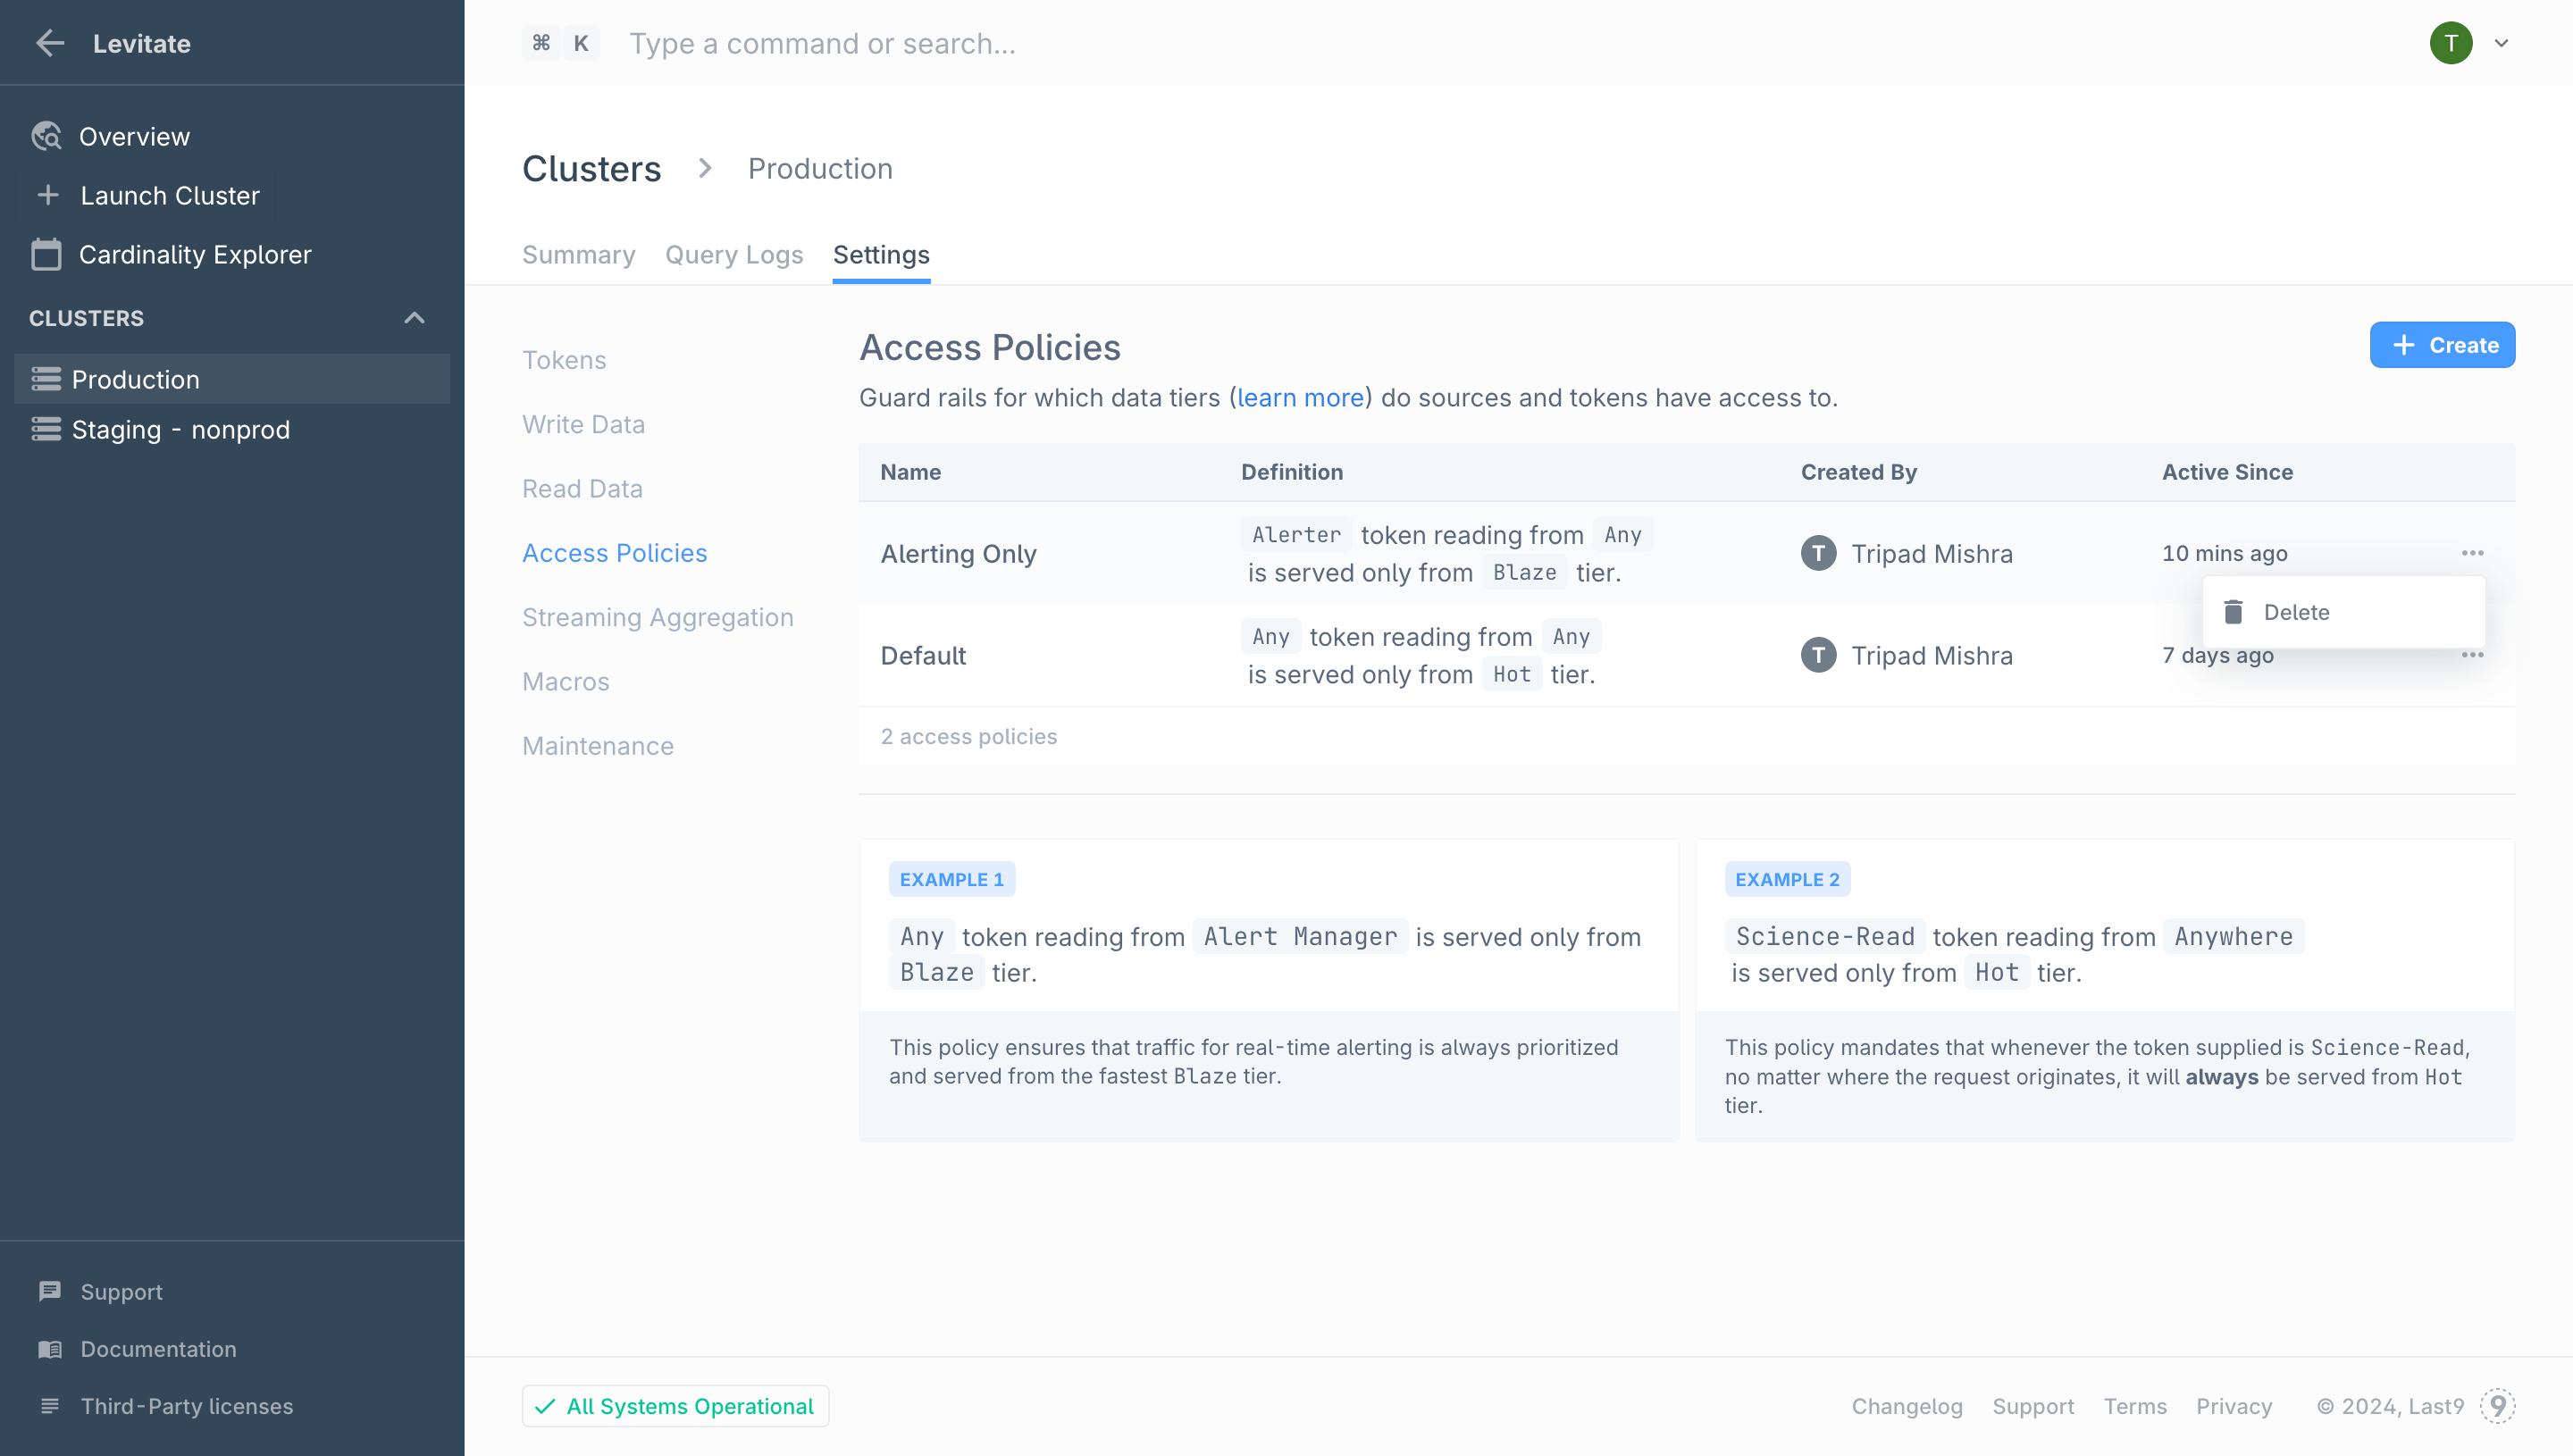
- Select Delete from the menu
Do Note:
- Access policies can only be deleted by the admin user(s) of your org
- Deleting an access policy may limit or lock access for a client or token, please be mindful before deleting
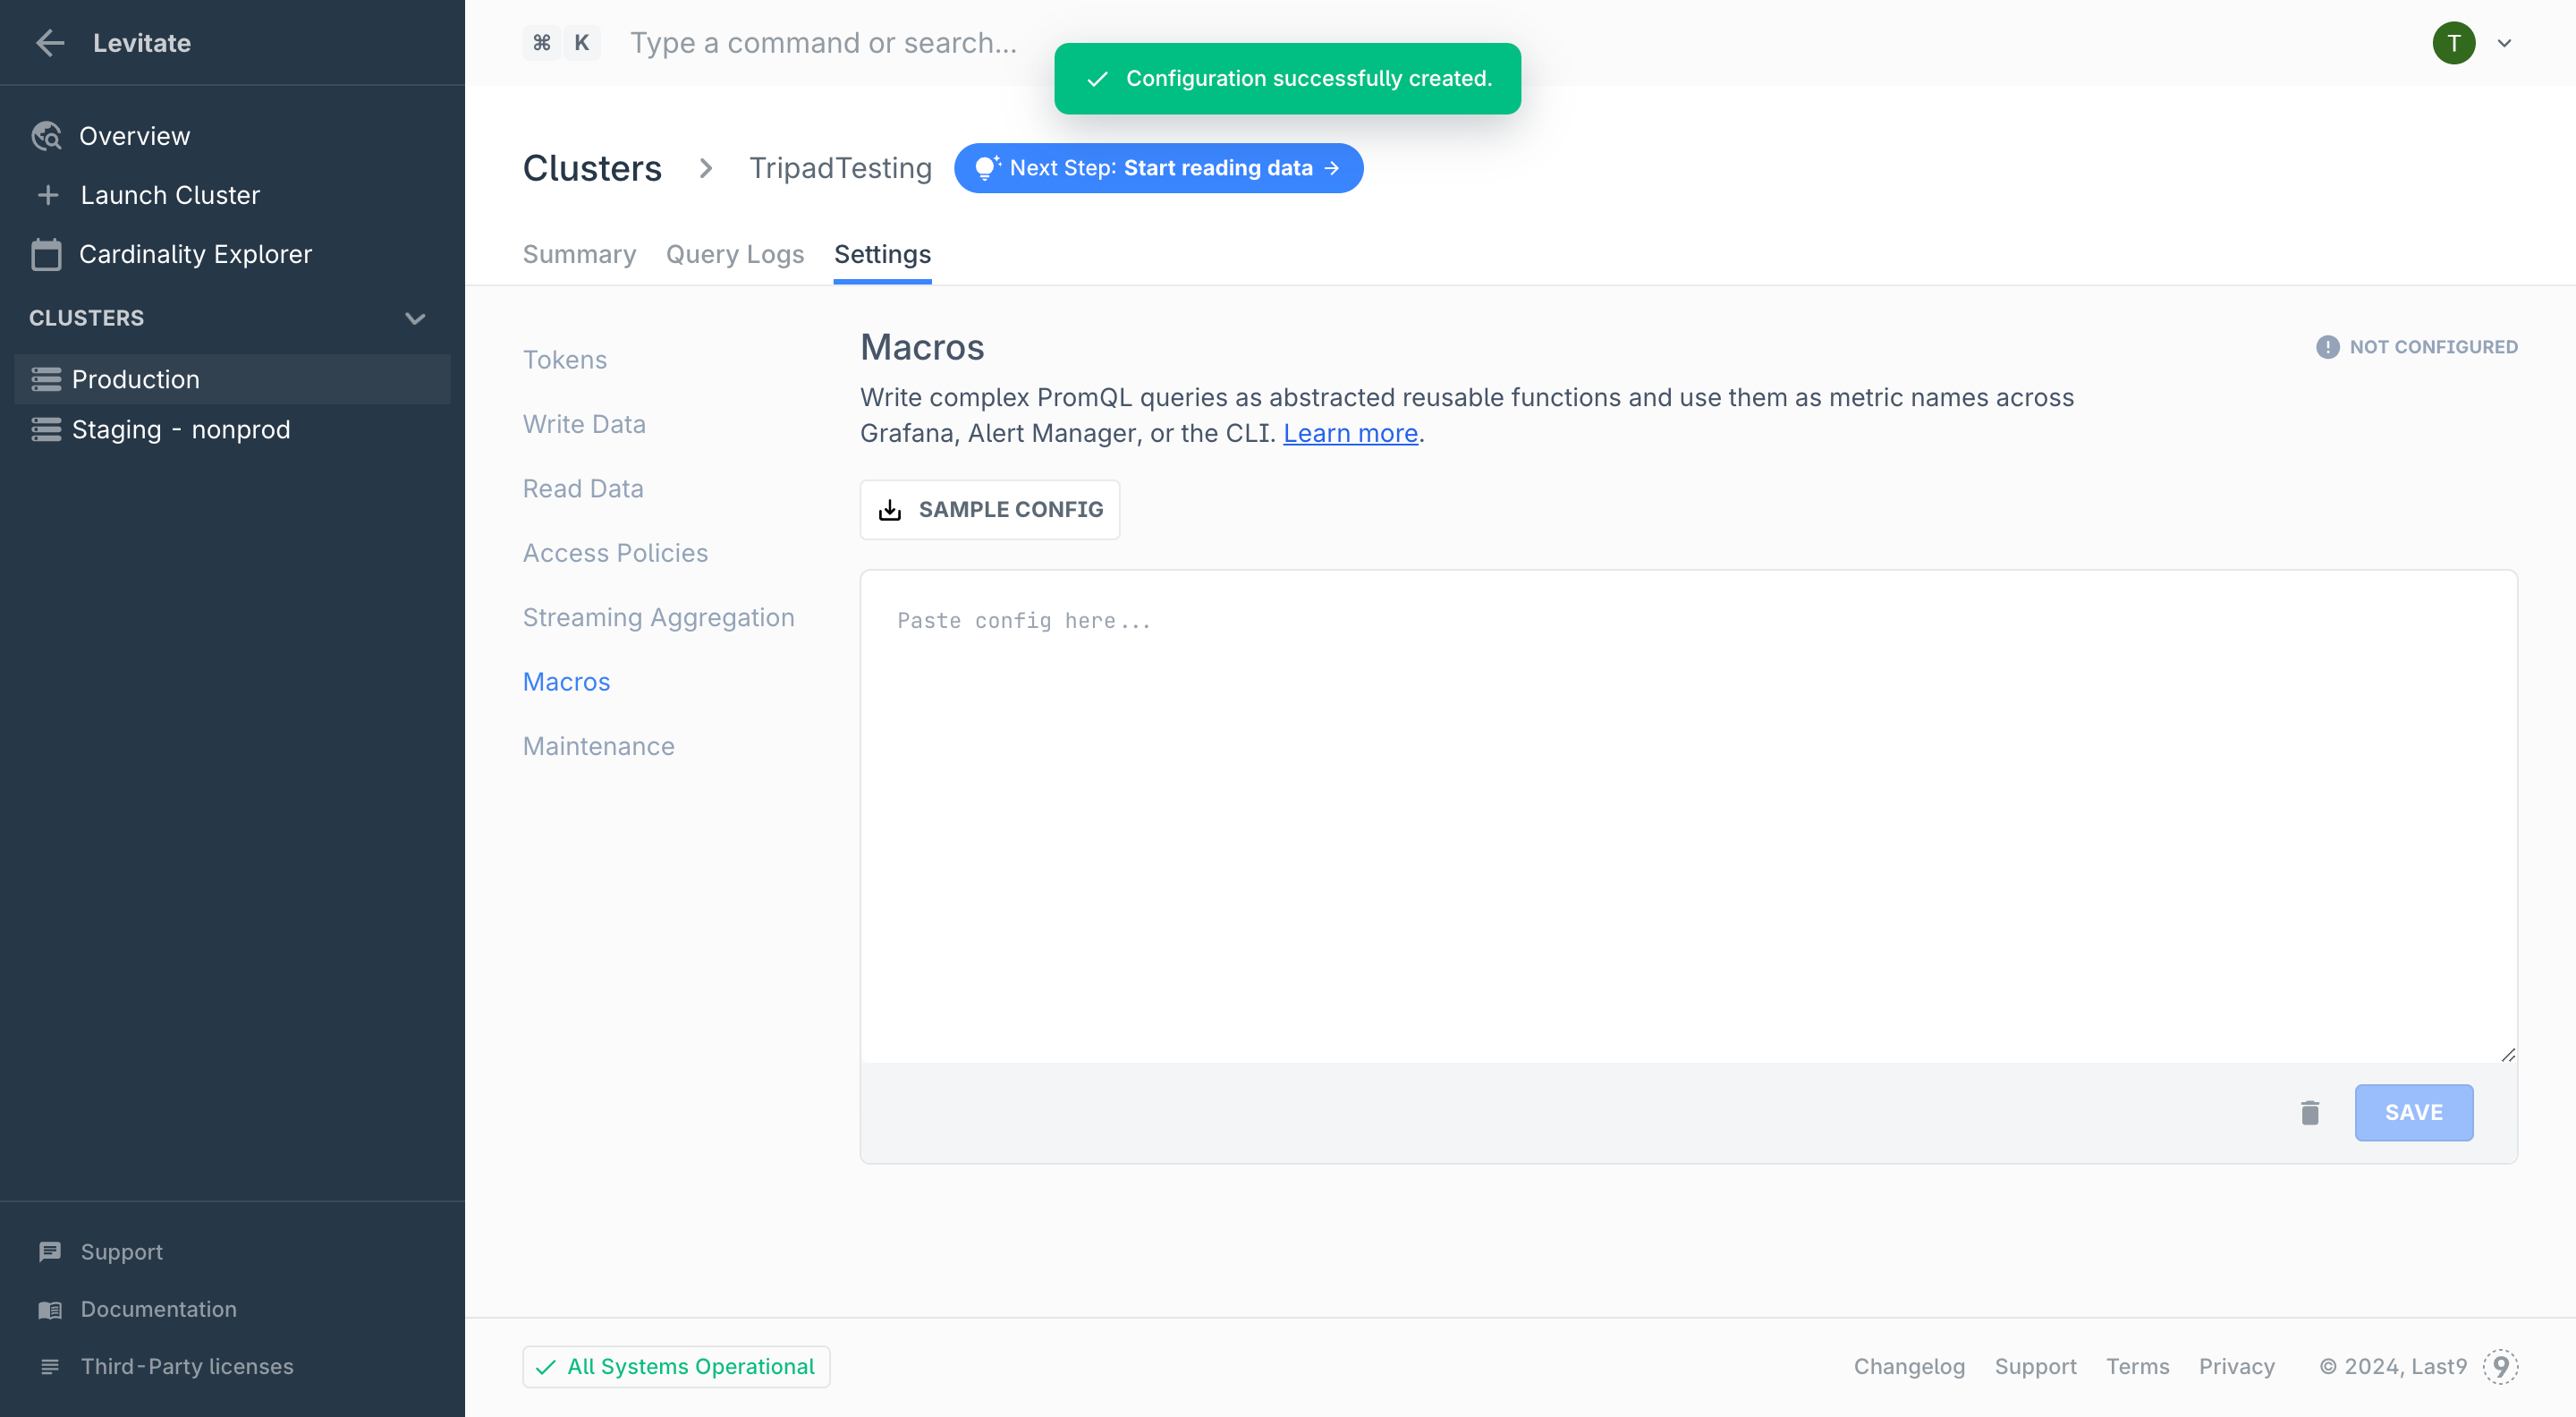
Macros
Macros lets you define PromQL queries as reusable functions and use them as abstracted metric names across Grafana, Alert Manager, or the CLI
We cover how to define and use Macros in detail in guide on PromQL Macros
Enabling Macros:
- Navigate to Control Plane → Macros
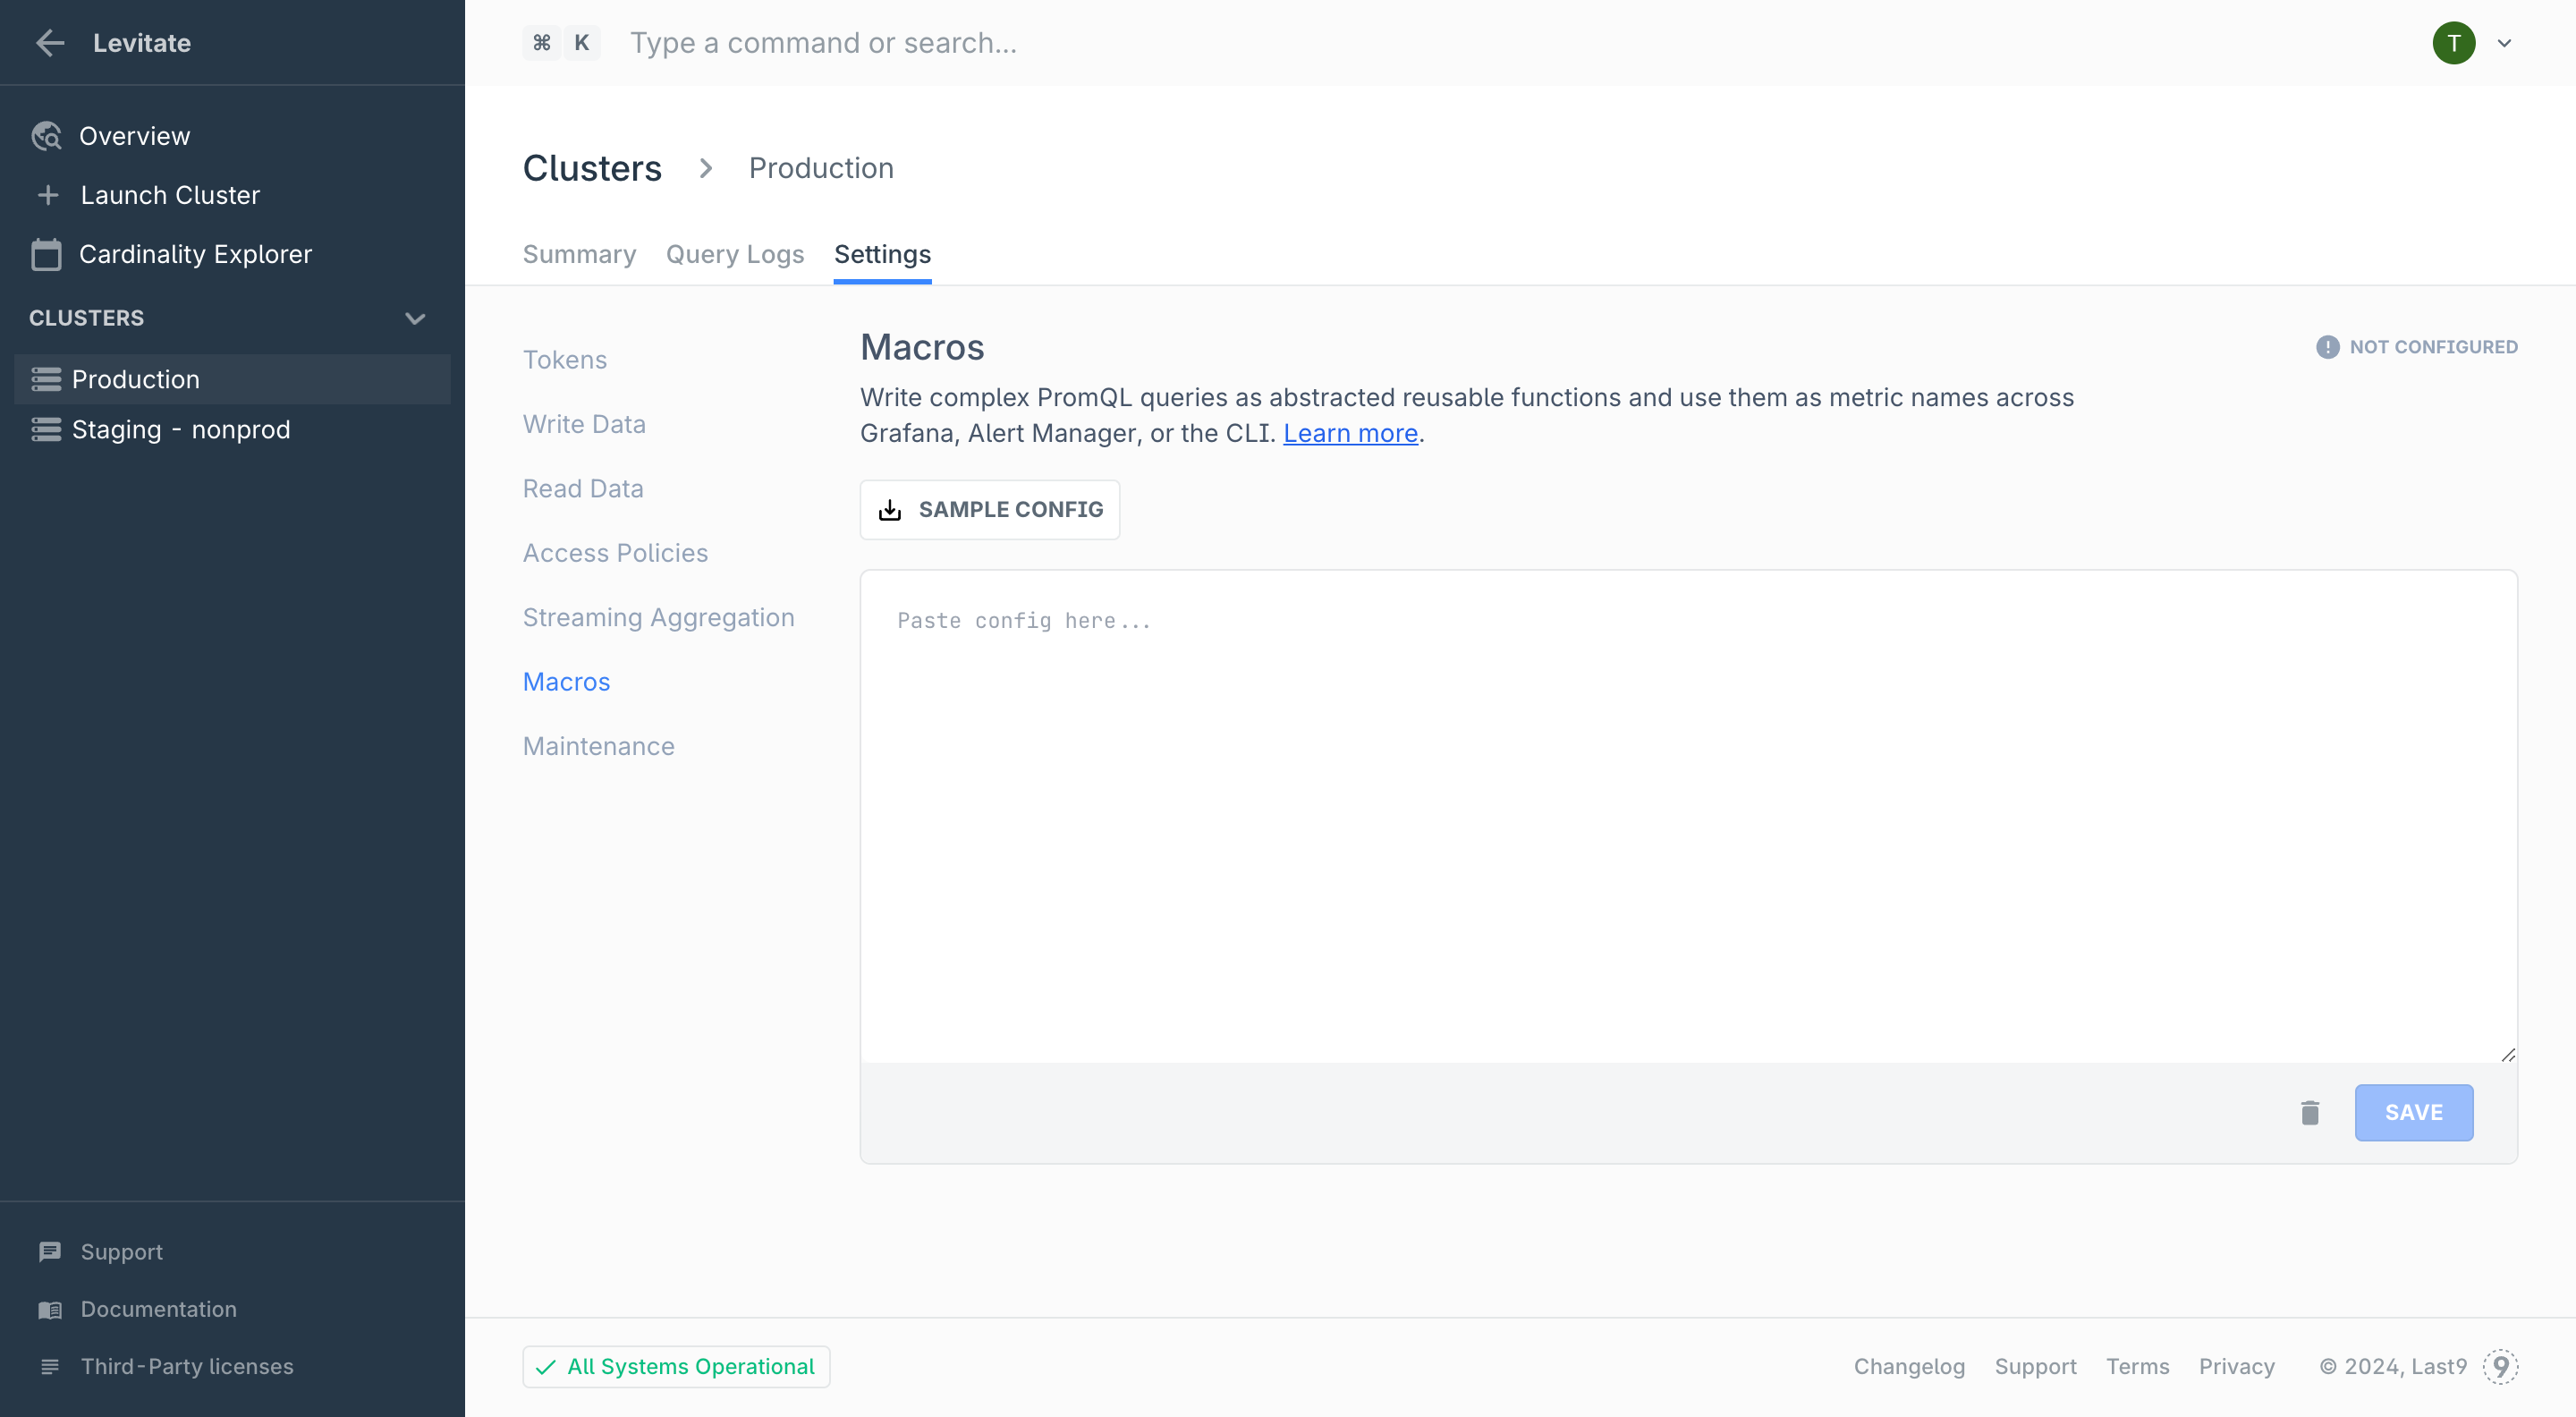
- Write/Paste your Macro function and Click Save
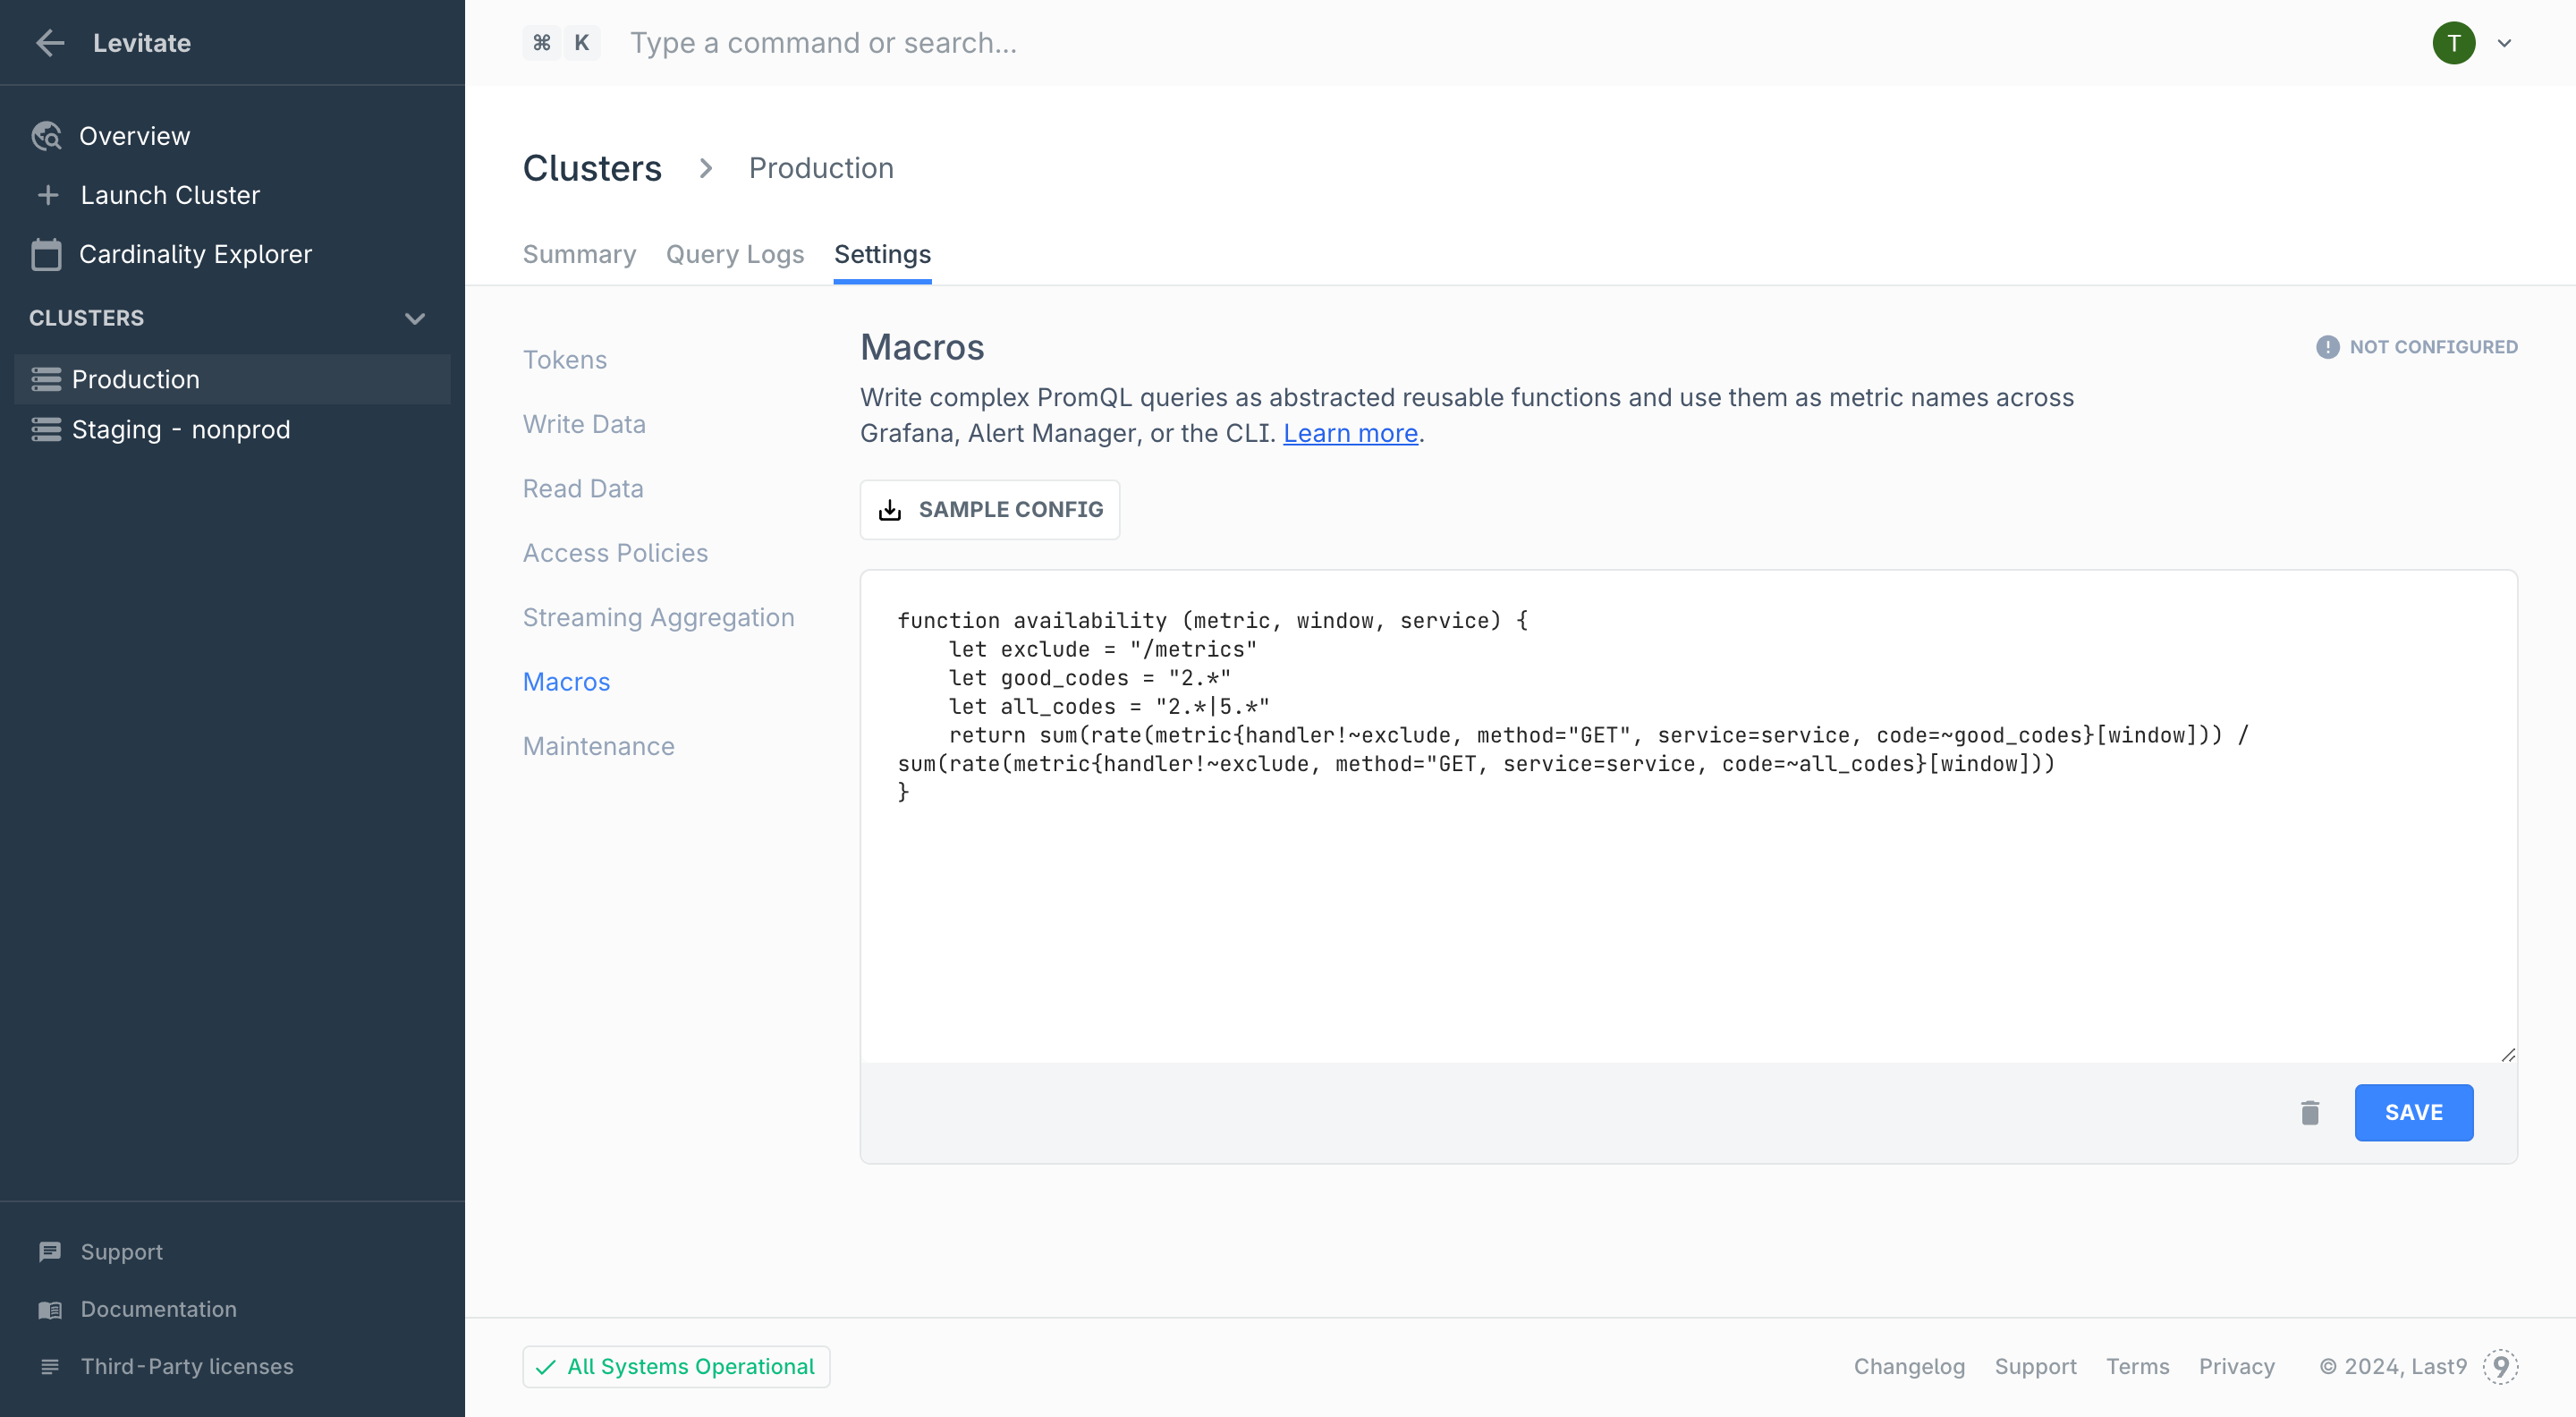 We perform validation once you click Save
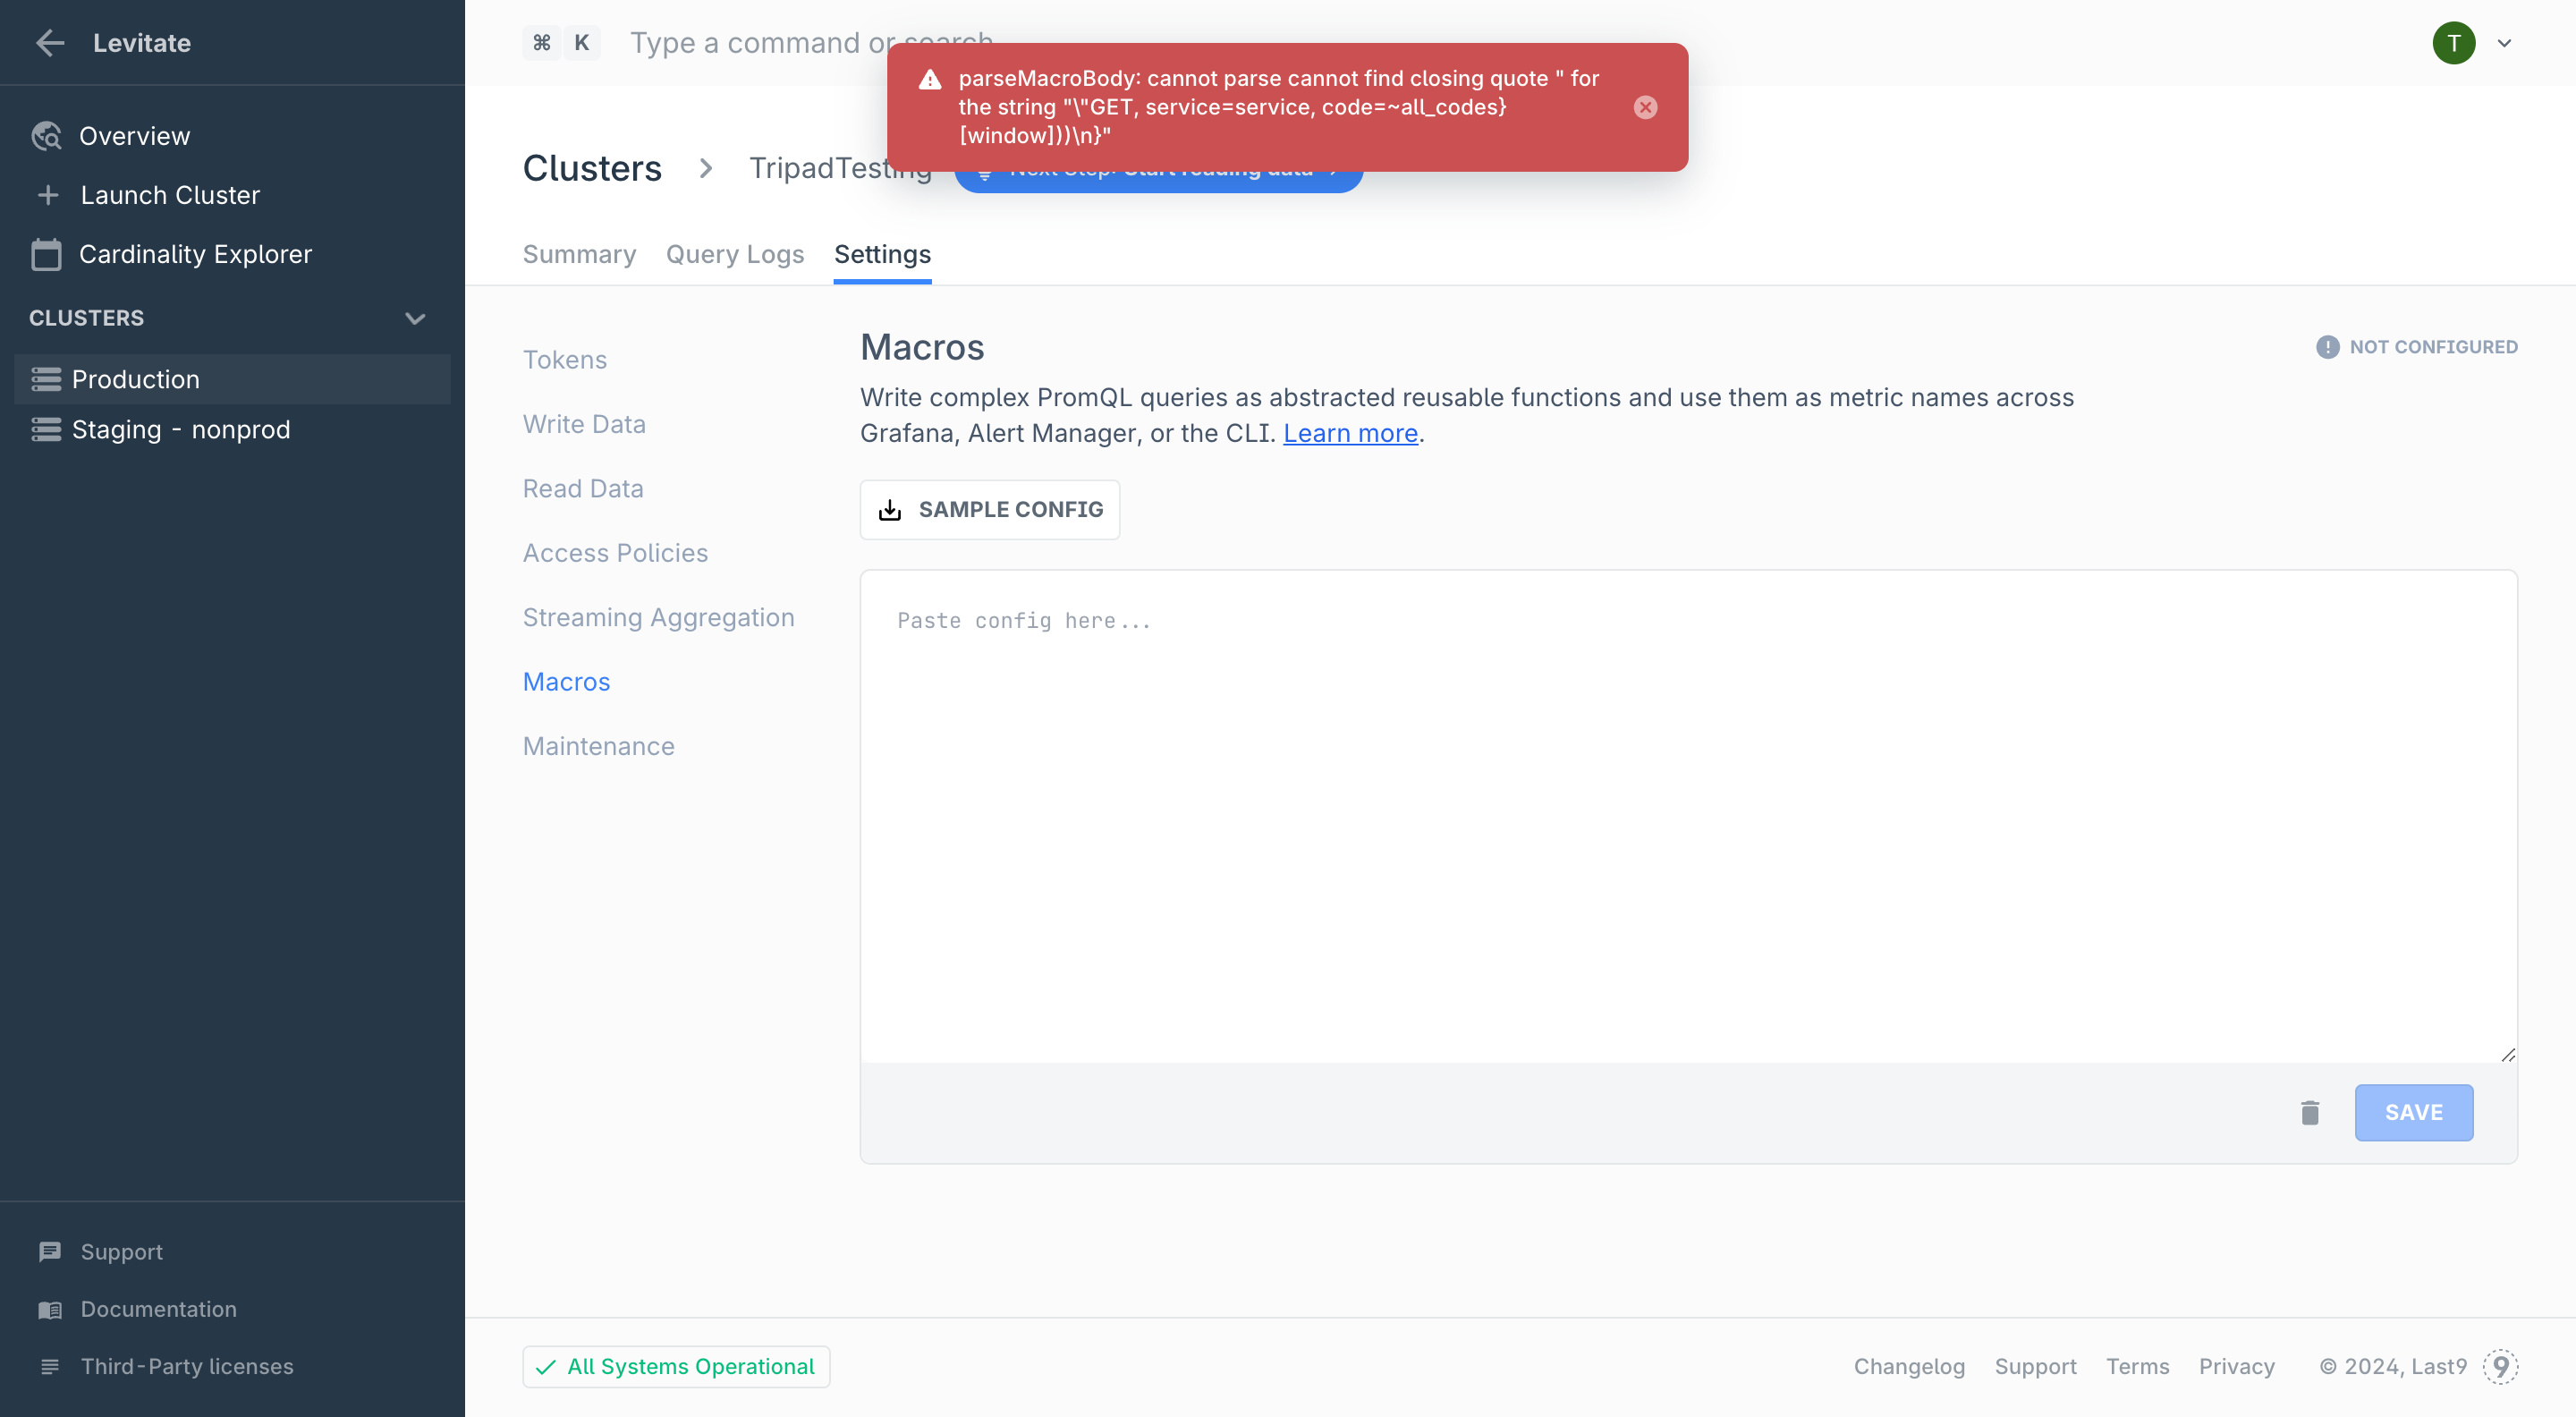 Once validated, we will save your Macro function. Do note that it will take upto 5 minutes for new Macros to be available for querying
Deleting Macros:
- Navigate to Control Plane → Macros
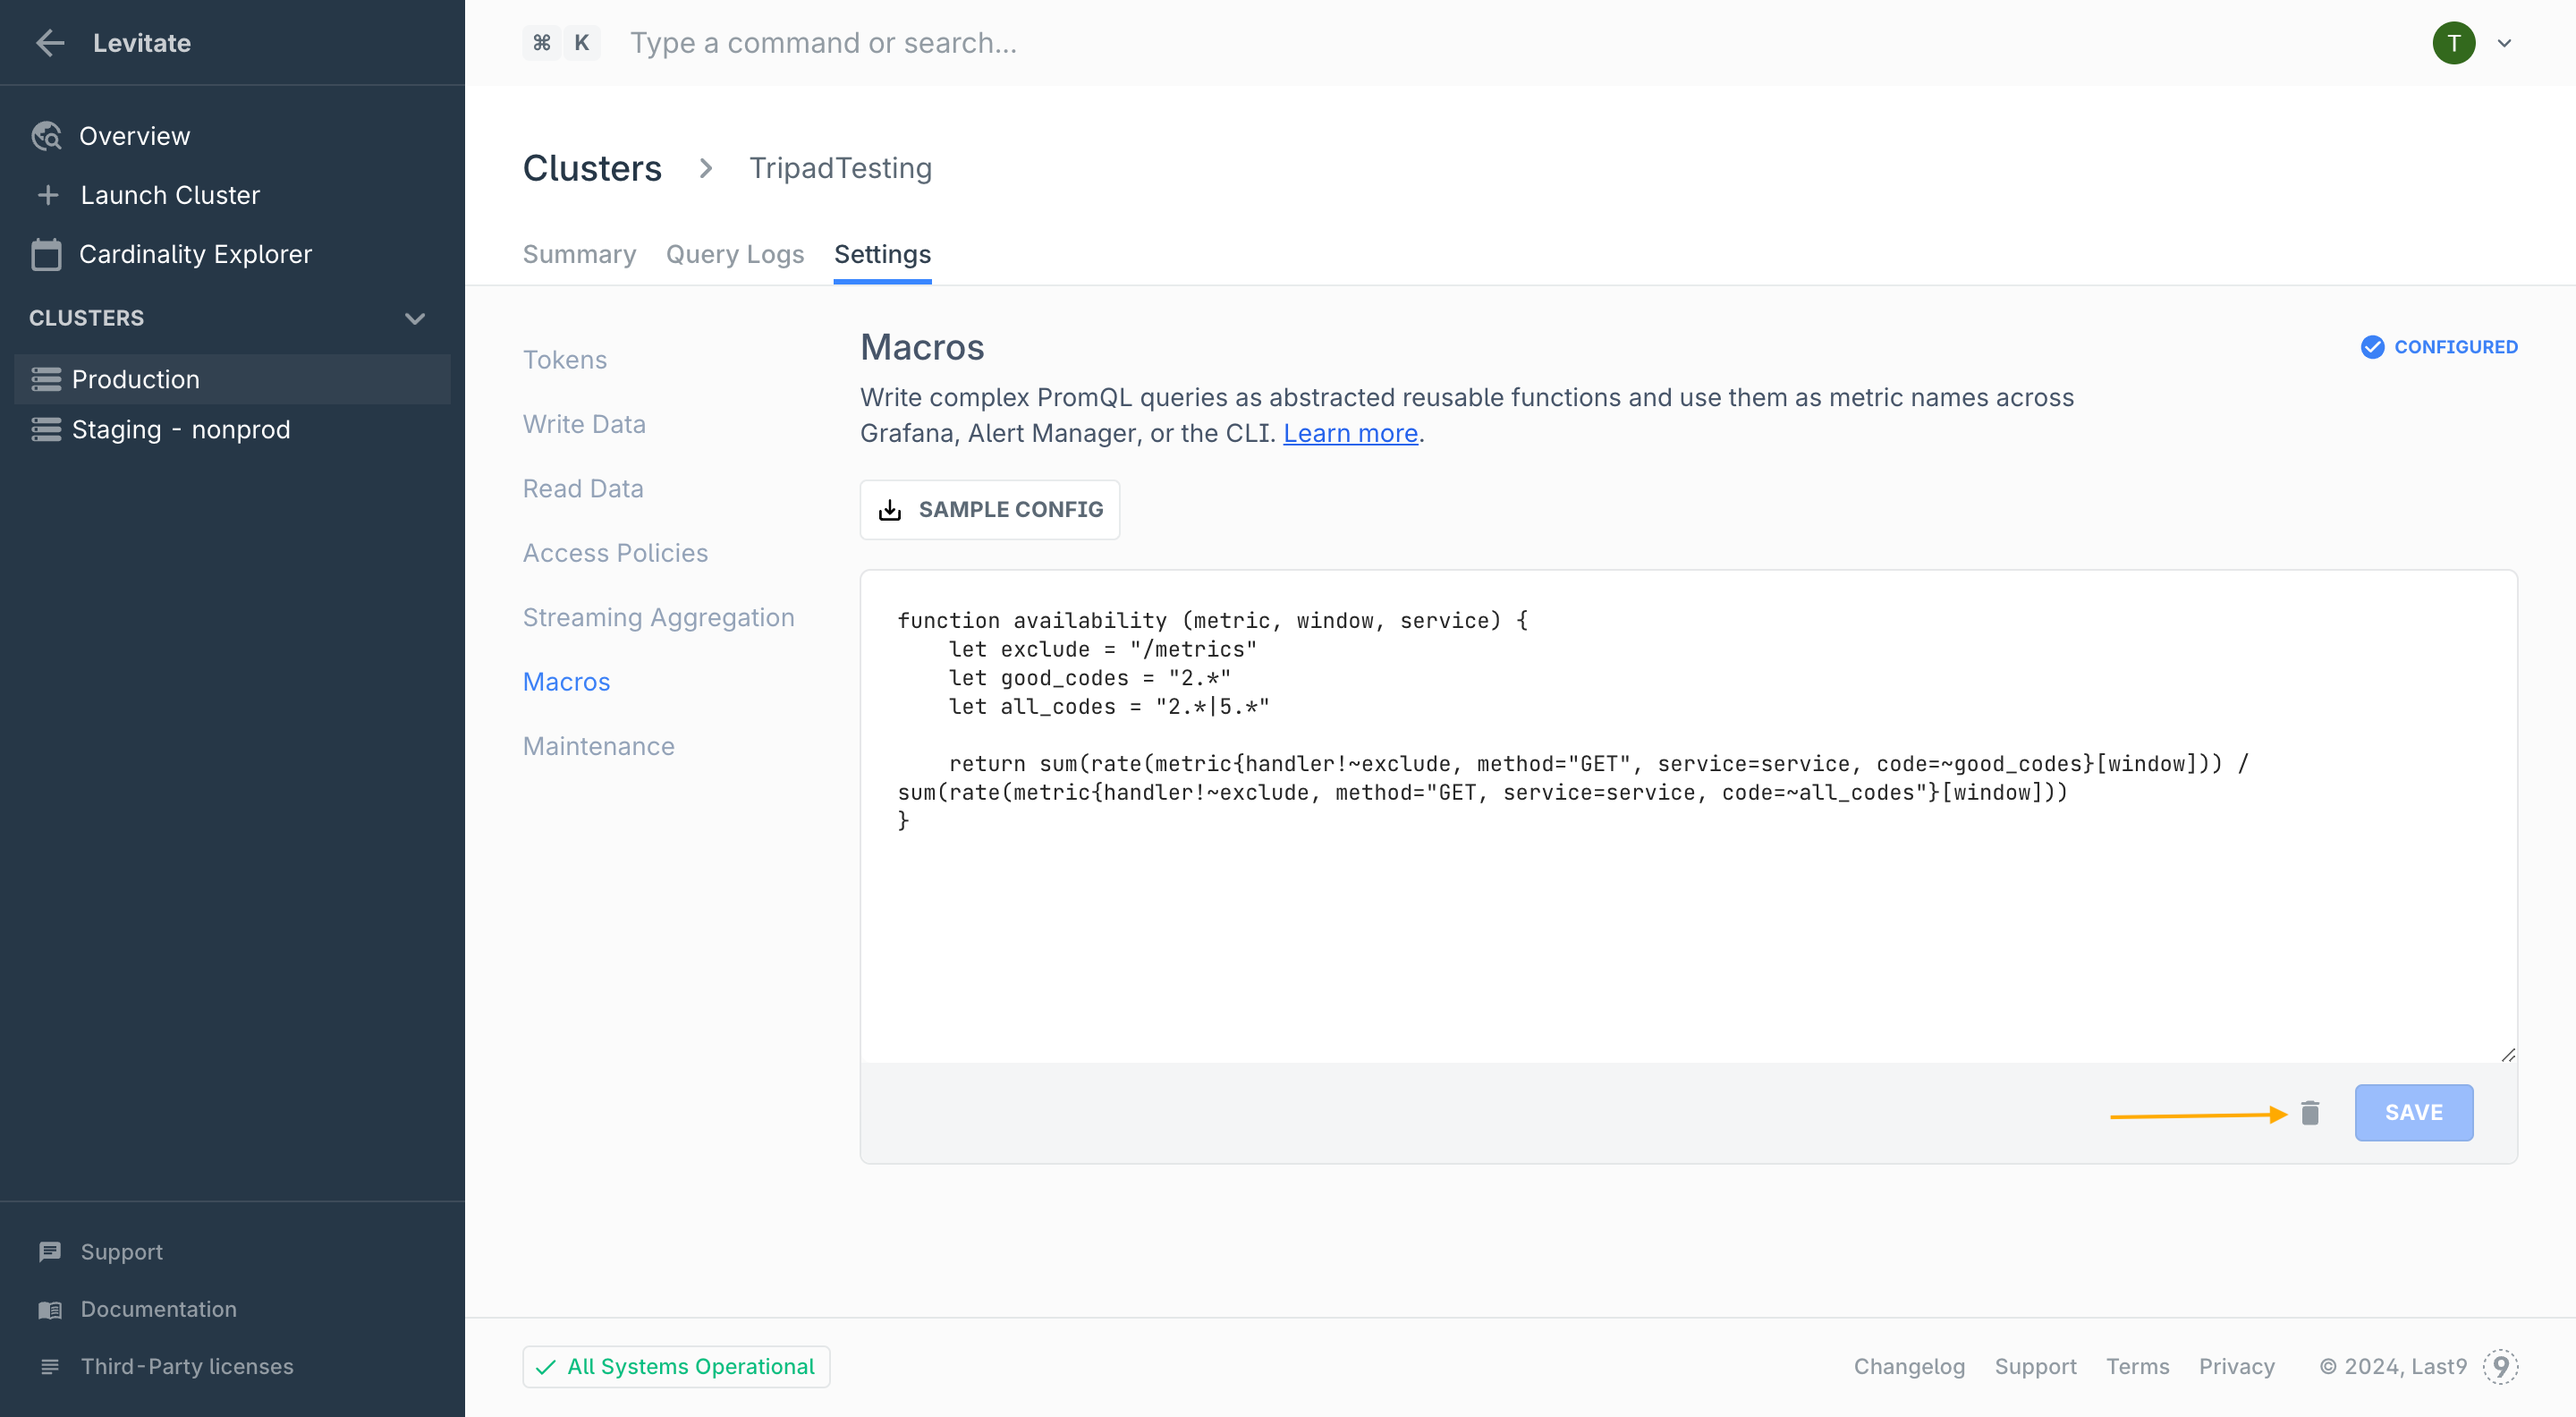
- Click the delete icon and click confirm
Note:
- Deleted Macros will impact any queries and dashboards where the macro functions were used
- Deleted Macros may be available for queries up to 5 minutes after they have been deleted
Streaming Aggregation
Streaming aggregation is a powerful metric cardinality that is built-in with Last9. Refer to our Guide on Streaming Aggregation for an in-depth tutorial