Configuring an Alert
A step-by-step guide to configuring an alert rule in an Alert Group
Pre-requisites
To be useful, each Alert Group needs Alert Rules to enable monitoring the health of the Alert Group. If you've created an Alert Group by importing from a Managed Grafana dashboard, indicators will already exist based on the PromQLs used in the dashboard. Else, you'll need to create a new indicator. Indicators are required to be selected while creating an alert rule.
Rule Configuration
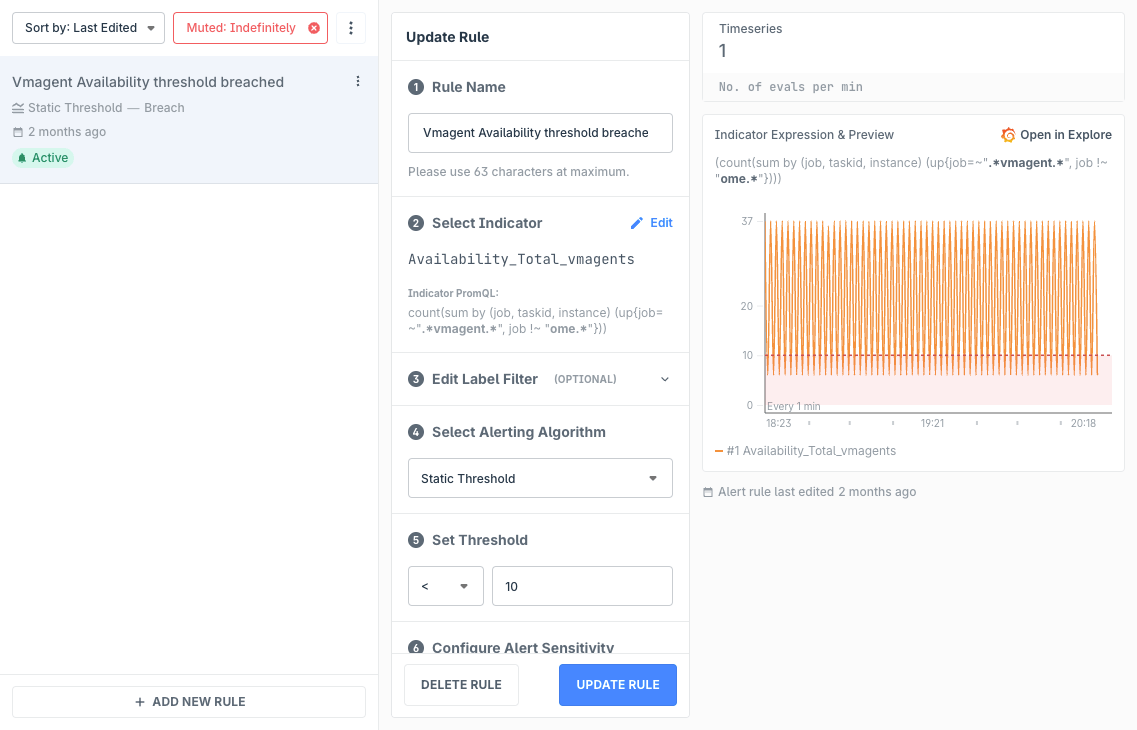
Rule Name
Short and simple is good for quick identification when a notification is triggered. Keep in mind that Alert Rule names are shown along with the Alert Group names in the notification. If you want to add more context, use the Rule Description field in the Annotations section.
Select Indicator
Alert Rules are run against an Indicator. If you've imported a Grafana dashboard, Indicators are auto-generated based on the dashboard panel PromQLs, else you'll have to first add the relevant Indicator. Indicators inherit the ALert Group's datasource, but can also have their own as an override.
Edit Label Filter (optional)
Indicator queries support PromQL variables. If the query contains a variable, you're able to specify a specific label filter for the Alert Rule to be triggered only for that.
Select Alerting Algorithm
By default, only Static Threshold is enabled. If you would like to use our Anomaly Detection algorithms, please write to us at support@last9.io.
Set Threshold
This section is only visible if you've selected Static Threshold. You can select an operator and set the value of the threshold. The alert rule will only trigger when it matches the threshold's criteria.
Configure Alert Sensitivity
Depending on the algorithm selected, the options may vary here.
In case of Static Threshold, you can specify the no. of bad minutes the rule needs to be triggered out of no. of total minutes before it appears as firing in the Alert Monitor or send a notification.
In case of the Anomaly Detection algorithms, you can specify a value ranging from 0 to 10, and decimal values are accepted. Lower the value, the more sensitive the algorithm will be. You can click on the backtest button in the preview panel to open the indicator and algorithm calculations in Grafana and see at what values will the algorithm trigger. Play around with the query in Grafana to find a balance that you're comfortable with.
Severity Level
Select if this rule, when firing, should be treated as a threat or a breach. This is helpful as additional metadata for integrations like PagerDuty and OpsGenie to determine severity levels and route accordingly.
Notification Grouping
When the alert rule is firing for multiple labelsets, it may lead to noise. For such case, you may group notifications to a single instance. Such notifications do call out the no. of labelsets and values the alert rule is firing for.
Annotations (optional)
Annotations are used to include additional meta data to alert notifications for an alert rule. For example, to help your team members better understand the context of an alert notification, you may want to include a brief description outlining the behavior or circumstances when the rule should've triggered. Or, include a runbook link for quickly reaching the next to-do steps for your team member.
Dynamic Annotations
Annotations can be supercharged by inserting dynamic values using template variable. Currently, the following variables are supported:
- Labels, where it is the value of the respective label of timeeries under alert, with the syntax
{{ $labels.<label_name> }}or{{ .Labels.<label_name> }} - Value, where it is the worst value of timeseries under alert, with the syntax
{{ $value }}or{{ .Value }}
Template variables can be used alongside plain text as well. For example, Service name is {{ $labels.service }}. Usage of multiple variables in a field is also supported. Spaces in the template variable syntax are optional. Template variables can be used in any of the annotation fields — the rule description, runbook, or even custom annotations.
Considerations:
- Apart from the labels in the metric's timeseries, the labels of the Alert Group can also be referenced in template variables. In case the labels match, preference to the metric's timeseries is given
- In case a label value is not present, the template variable is shown as is
- In case the template variable syntax is incorrect, the UI will display an error. Please note the supported variables above and their respective syntaxes
- Notifications with Dynamic Annotations display these dynamic values. In case of grouped notifications, Labels are shown as a count of all label values and Values are shown as a P99 of all the worst values
Sample usage of Dynamic Annotations with Splunk
A custom annotation named splunk_debug_url is added to an alert rule whose value is configured as https://search.splunk.com/?service={{$labels.service}}&stack={{$labels.stack}}. When alerts are generated for one or more timeseries, the values of the variable in this custom annotation will be interpolated using the labels in the timeseries. For example, service=billing and stack=my-org will lead to link https://search.splunk.com/?service=billing&stack=my-org and so on.
Troubleshooting
Please get in touch with us on Discord or Email if you have any questions.