OpenAPM
OpenAPM is an Application Performance Monitoring toolkit based on Prometheus, and Grafana.
What is OpenAPM
The OpenAPM project was created to make monitoring the applications using Open Standards such as Prometheus and Grafana easier. It consists of auto-instrumentation libraries for popular languages, standard Grafana dashboards for visualization and alerting rules.
Instrumentation
OpenAPM supports auto-instrumentation of Node.js, Ruby, Golang and Python applications.
Once the OpenAPM instrumentation package is set up in your application, you can scrape the metrics via the Prometheus agent and push it to Prometheus or a Prometheus-compatible long-term storage like Last9.
The metrics can be sent to Prometheus using Prometheus Remote Write Protocol.
Advanced Capabilities
The OpenAPM instrumentation libraries support following additional capabilities over instrumenting RED metrics.
Multi-Tenancy support
- Extract tenant information from the URL and emit as a label
- Additional labels and metadata can be extracted by using Regular expressions
Default labels
- Add any number of constant default labels apart from the request metrics
Track application lifecycle events
- Support for tracking change events such as
application_started.
Querying
OpenAPM data is stored in Prometheus compatible systems, so one can use PromQL to query the data.
Visualization
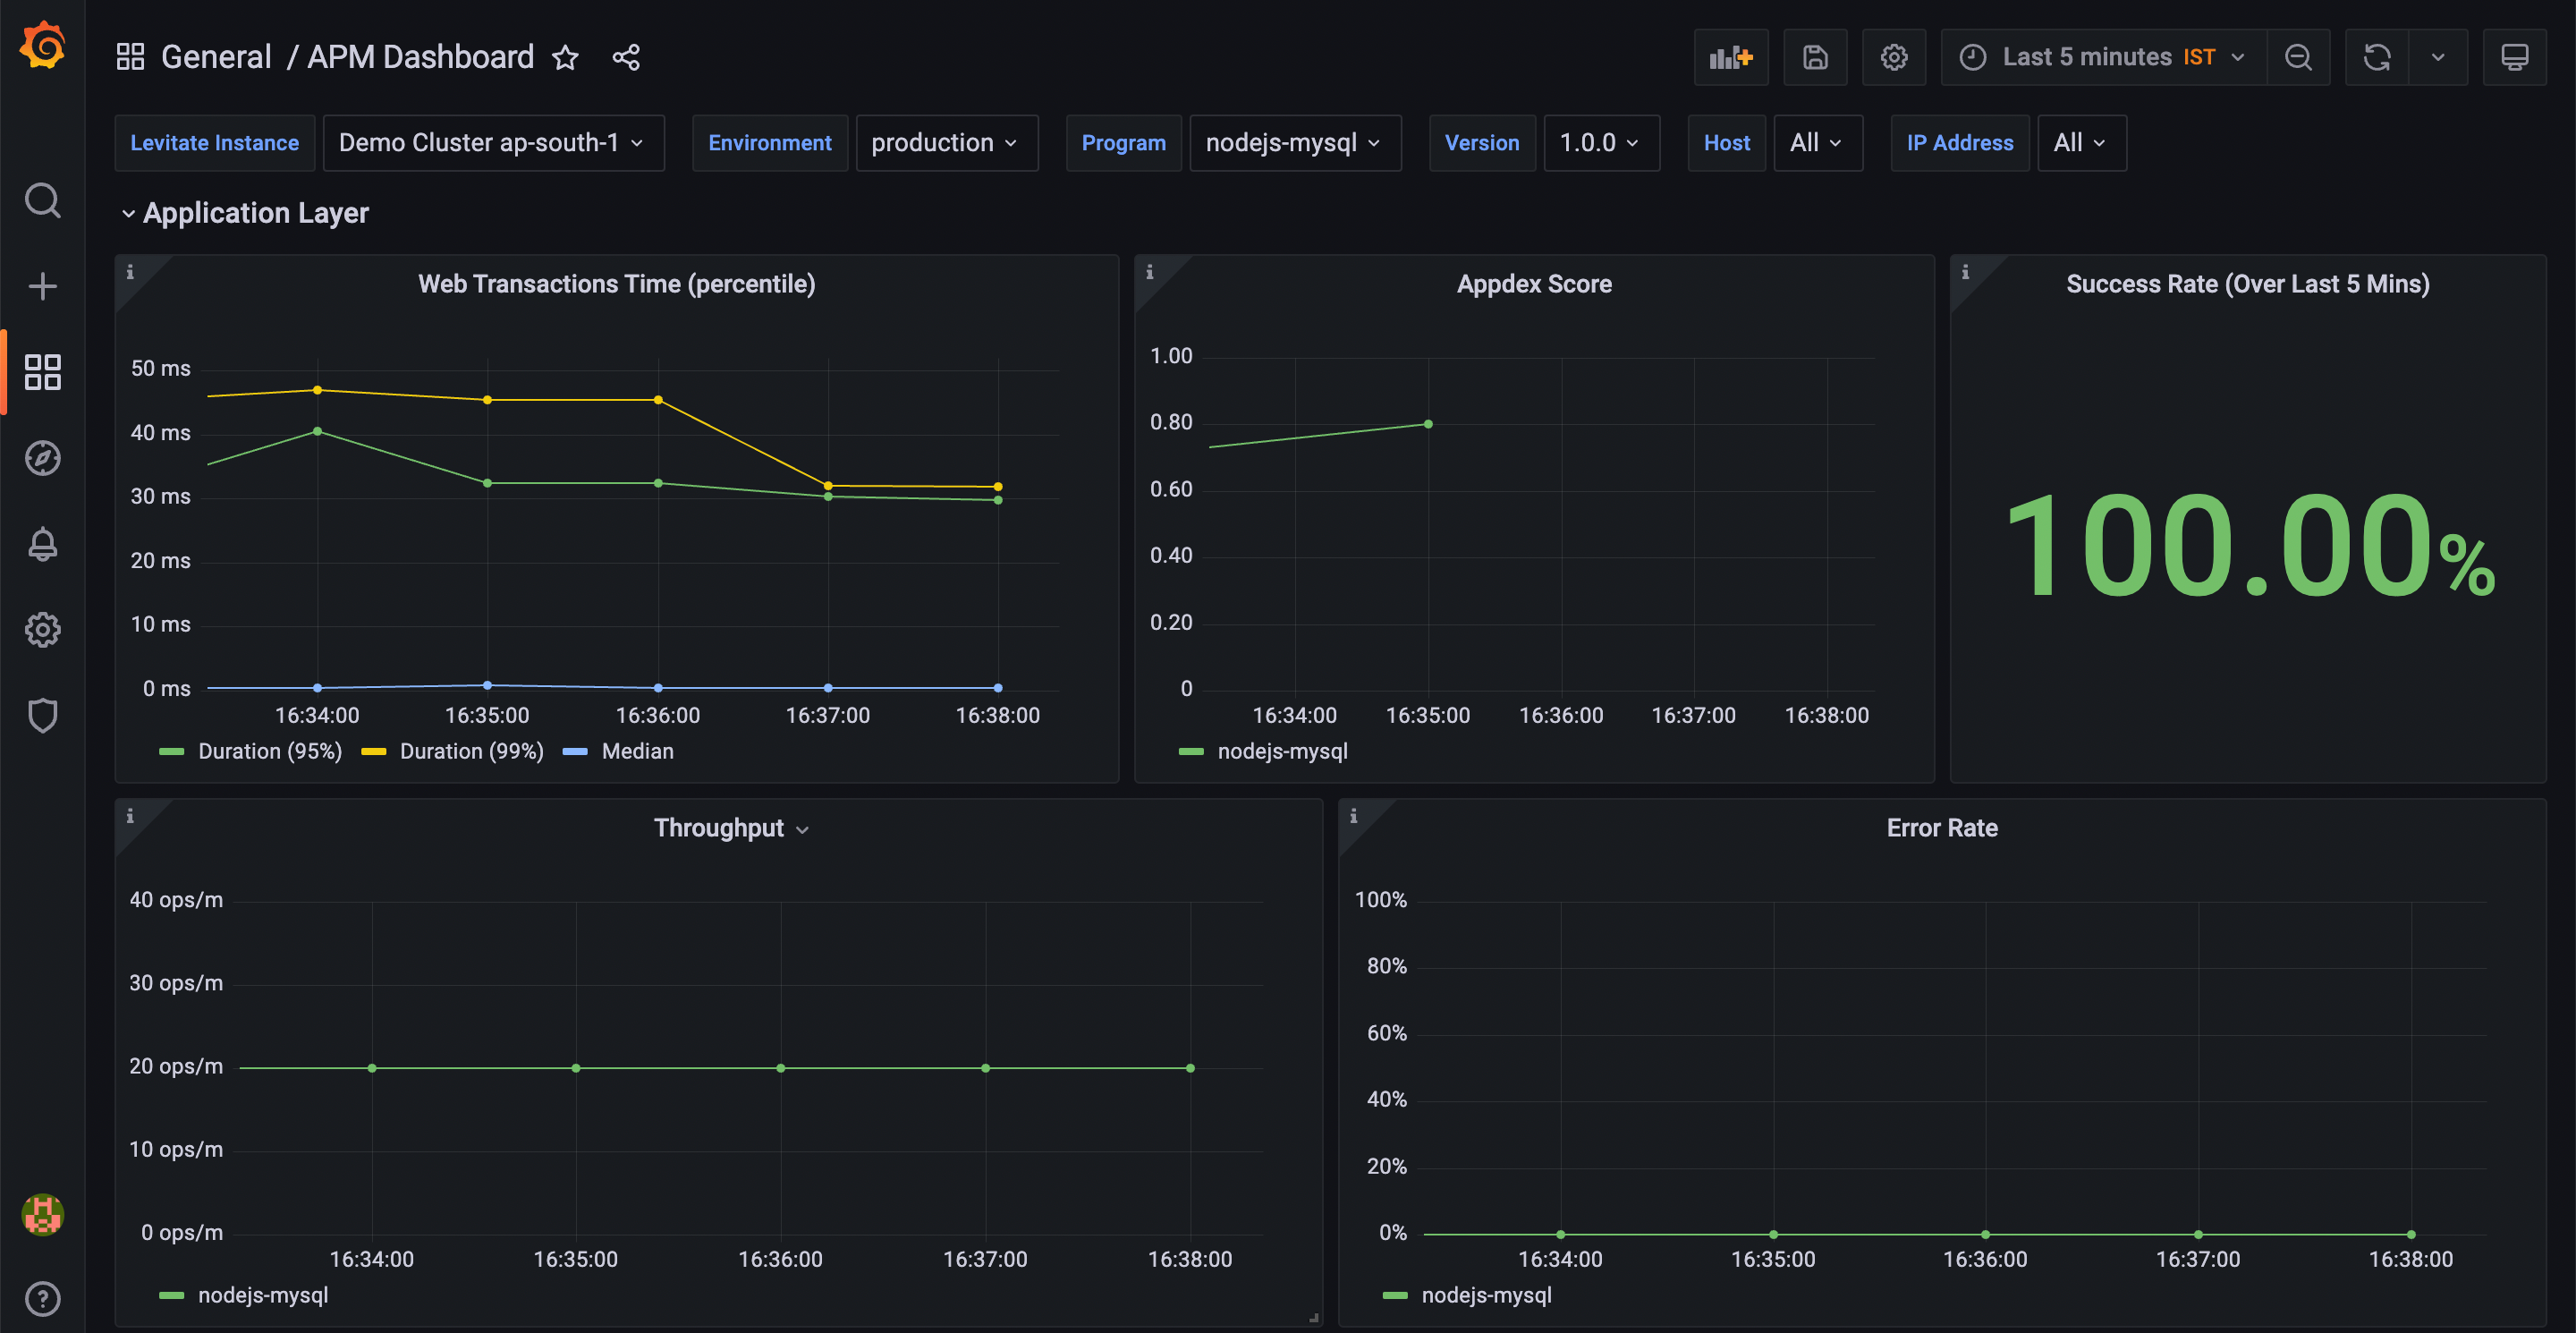
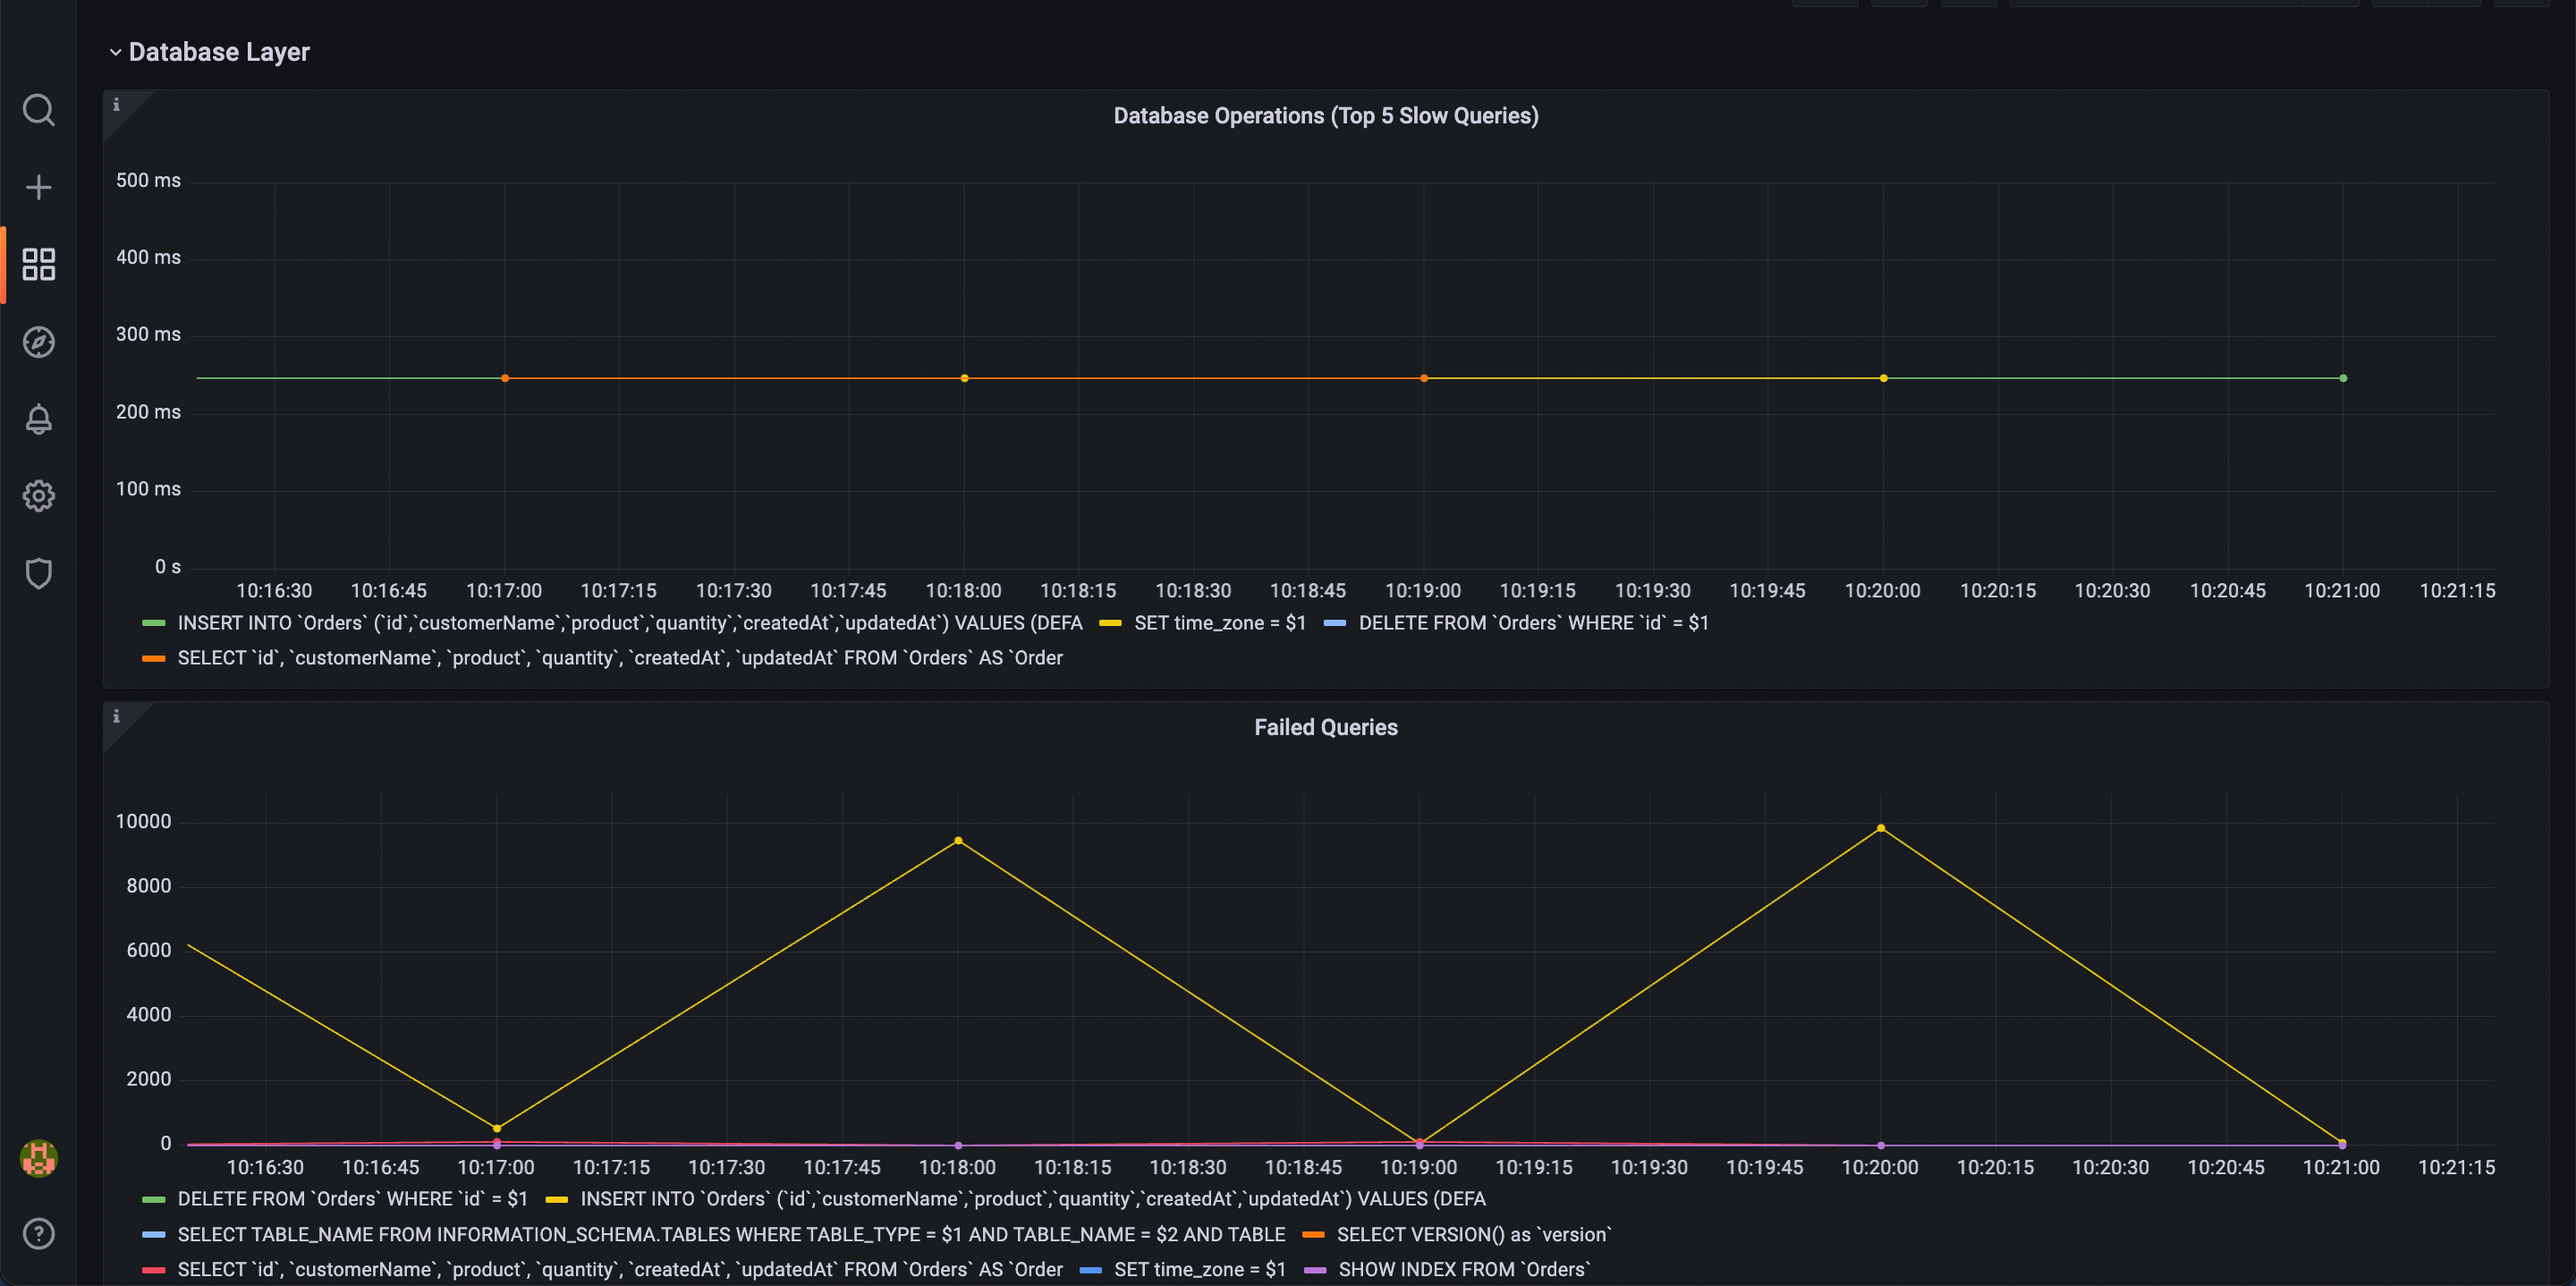
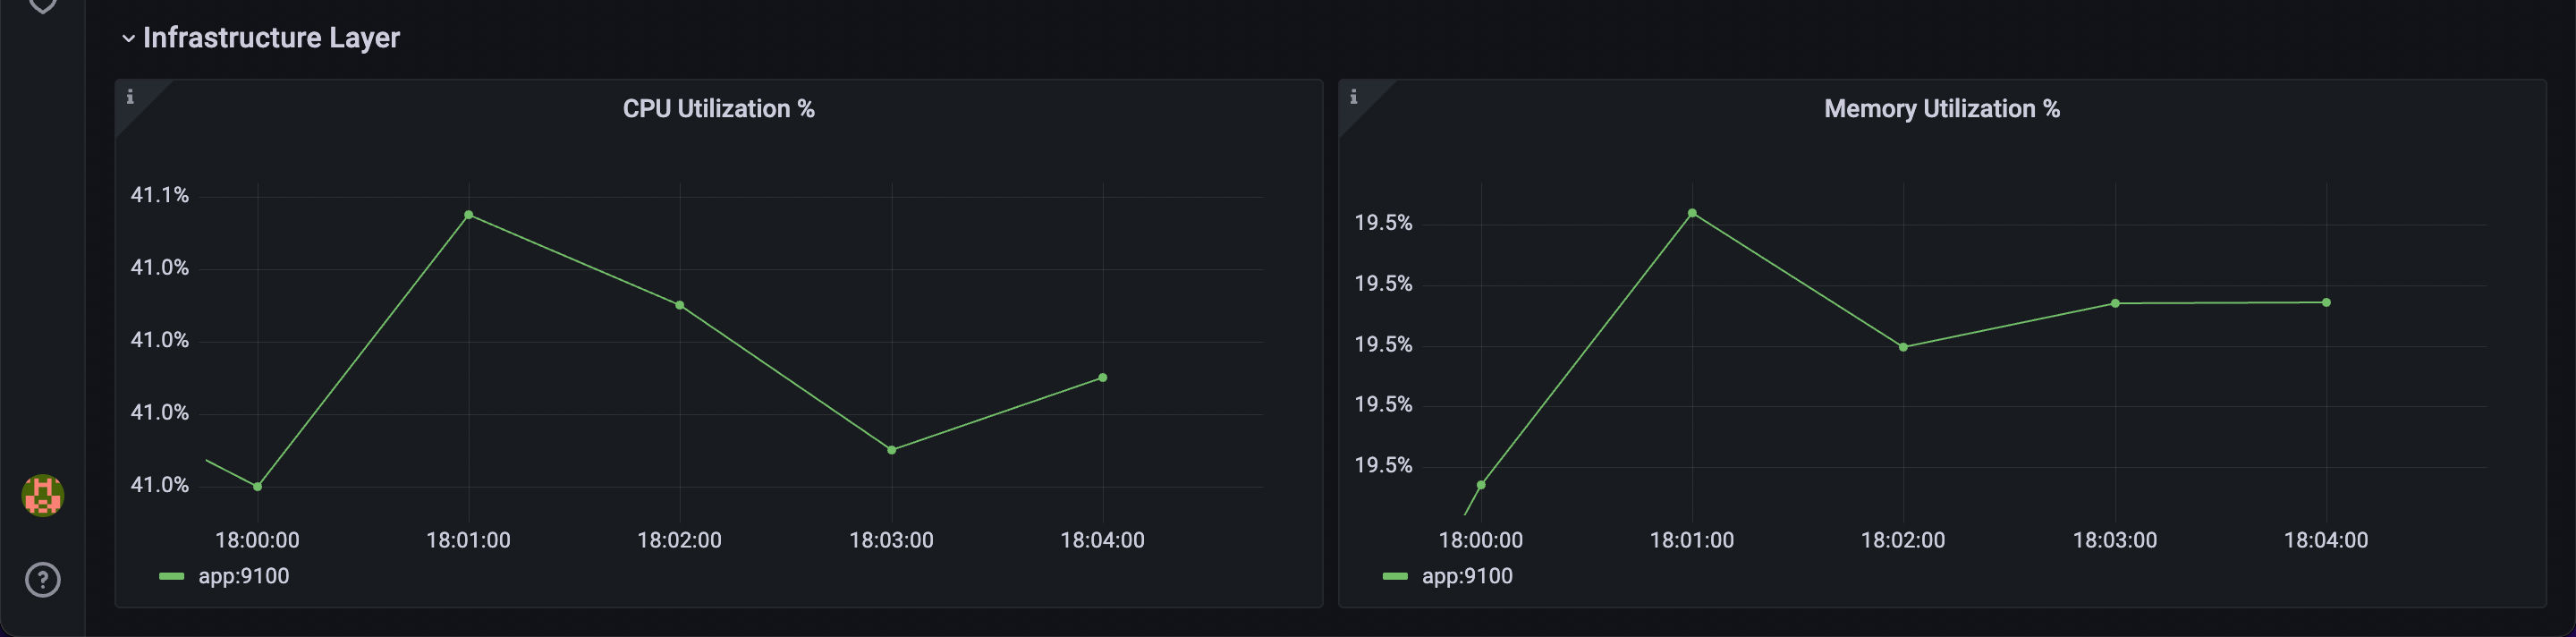
OpenAPM collection ships with ready to import Grafana dashboards for applications to understand key performance indicators such as Apdex score, slow endpoints and slow database queries among many others.
Steps to import default dashboard
- Import this dashboard into Grafana
- Set up the data source to the one where metrics from OpenAPM are getting sent
- Save the dashboard
Alerting
OpenAPM comes with standard alert definitions that can be used to monitor the applications.
Apdex score calculation
Apdex stands for Application Performance Index. It is a measure of application performance with respect to user satisfaction.
Why is the Apdex score a better measure of application performance?
The definition of application performance varies as per different personas. For the engineer, it's response time; for SRE, it's uptime; for the product manager, it is user retention on the product. These definitions vary as per the roles or priorities of each role. In such cases, we have to find a uniform way to measure the application performance across multiple services, applications, and teams. How to do that?
Apdex solves that problem by quantifying user experience to a number, as at the end of any business all roles are trying to find user experience by using different measurements.
To define Apdex in terms of user experiences, we take three different categories of users.
- Satisfied: One who enjoys the application experience without hiccups or slowness
- Tolerating: One who faces a lag or slowness but keeps using the application without complaining
- Frustrated: One who abandoned the application due to lag or slowness
Based on application response time, the Apdex score measures satisfied, tolerating, and frustrated users.
How to find an Apdex score for an HTTP application?
-
Define a satisfied user response time threshold, for example, a happy customer would get a response within 1 second
-
4 times the satisfied user threshold defines the threshold for tolerating users. So, using the above example, anything from 1 second to 4 seconds defines the tolerating user response time. Anything above that defines frustrated user response time
-
Find the Apdex score by:
Apdex score = (
                  No. of satisfied users +
                  (0.5) * No. of tolerating users
                   + 0 * No. of frustrated users
              ) / Total users
For any application, the number of users can be quantified by the number of requests, which is throughput.
Assumptions:
- Application received 1000 requests in total
- The satisfied user threshold is 1 second
- No. of requests finished within 1 second = 600
- No. of requests finished within 1 to 4 seconds = 200
- No. of requests finished greater than 4 seconds = 200
Apdex Score will be:
-
Satisfied users: (600 * 1 = 600)
-
Tolerating users: (200 * 0.5 = 100)
-
Frustrating users: (200 * 0 = 0)
Apdex score = (600 + 100 + 0 ) / 1000 = 0.7
PromQL to calculate Apdex score
For calculating the Apdex score, OpenAPM utilizes following metrics:
-
http_requests_duration_milliseconds_bucketwhich denotes the latency of the application -
http_requests_duration_milliseconds_countwhich denotes the throughput of the application -
OpenAPM uses P50 as the measure of satisfied users. This is dynamic threshold which measures user experience in real time
histogram_quantile(0.50, sum by (le) (rate(http_requests_duration_milliseconds_bucket{}[4m])*60)) -
Satisfied Users as satisfied_users
 sum(
   topk(1, sum by (le) (rate(http_requests_duration_milliseconds_bucket{}[4m]) * 60)
   and
label_value(sum by (le)(http_requests_duration_milliseconds_bucket{}), "le") < threshold)) -
Tolerating Users as tolerating_users
sum(
   topk(1, sum by (le) (rate(http_requests_duration_milliseconds_bucket{}[4m]) * 60)
   and
   label_value(sum by (le)(http_requests_duration_milliseconds_bucket{}), "le") <  4 * threshold))

-

sum(
   topk(1, sum by (le) (rate(http_requests_duration_milliseconds_bucket{}[4m]) * 60)
   and
label_value(sum by (le)(http_requests_duration_milliseconds_bucket{}), "le") < threshold)) -
Total Users as total_users which considers total requests
sum (rate(http_requests_duration_milliseconds_count{}[4m]) * 60)) -
Final PromQL
Apdex score = ( satisfied_users + ( tolerating_users / 2 ) ) / total_usersThe final PromQL to calculate the Apdex score is as follows.
((sum(topk(1,sum by (le)(rate(http_requests_duration_milliseconds_bucket{program=~"$program", version=~"$version", environment=~"$environment"}[4m])*60) and label_value(sum by (le)(http_requests_duration_milliseconds_bucket{program=~"$program", version=~"$version", environment=~"$environment"}), "le") <  histogram_quantile(0.50, sum by (le)(rate(http_requests_duration_milliseconds_bucket{program=~"$program", version=~"$version", environment=~"$environment"}[4m])*60)))) +

(sum(topk(1,sum by (le)(rate(http_requests_duration_milliseconds_bucket{program=~"$program", version=~"$version", environment=~"$environment"}[4m])*60) and label_value(sum by (le)(http_requests_duration_milliseconds_bucket{program=~"$program", version=~"$version", environment=~"$environment"}), "le") <  histogram_quantile(0.90, sum by (le)(rate(http_requests_duration_milliseconds_bucket{program=~"$program", version=~"$version", environment=~"$environment"}[4m])*60)))) - sum(topk(1,sum by (le)(rate(http_requests_duration_milliseconds_bucket{program=~"$program", version=~"$version", environment=~"$environment"}[4m])*60) and label_value(sum by (le)(http_requests_duration_milliseconds_bucket{program=~"$program", version=~"$version", environment=~"$environment"}), "le") <  histogram_quantile(0.50, sum by (le)(rate(http_requests_duration_milliseconds_bucket{program=~"$program", version=~"$version", environment=~"$environment"}[4m])*60)))))/2)
/
sum (rate(http_requests_duration_milliseconds_count{program=~"$program", version=~"$version", environment=~"$environment"}[4m])*60))
You don't need to remember this complex PromQL. Last9 clusters are equipped with PromQL macros and you just have to use
apdex_score(0.5, "<service_name>", http_requests_duration_milliseconds_bucket, http_requests_duration_milliseconds_count)
Explaining Functions used by the PromQL
label_value
label_value(sum by (le)(http_requests_duration_milliseconds_bucket{}), "le") < threshold
label_value is used to get any label value from a query.
Whatever labels are coming as part of output series from query, we can select which label values we are
interested in by providing it's label as 2nd argument to label_value
Here threshold is latency (P50) so it must be either in seconds or milliseconds.
On receiving label value le which gives time buckets, we are filtering all buckets which has value less than threshold.
and operator
sum by (le) (rate(http_requests_duration_milliseconds_bucket{}[4m]) * 60)
     and
label_value(sum by (le)(http_requests_duration_milliseconds_bucket{}), "le")
and operator is used to finding intersection between first query and second query.
Here it will give all those timeseries where ouput timeseries of first query is intersecting with output
timeseries of second query.
topk
topk(1, sum by (le) (rate(http_requests_duration_milliseconds_bucket{}[4m]) * 60)
     and
     label_value(sum by (le)(http_requests_duration_milliseconds_bucket{}), "le") <  threshold)
topk is used to get top k number of series with highest value from query.
Understaing reason behind [4m]
The Counter is one of the metric types supported by Prometheus-compatible systems. The nature of these metrics is monotonically increasing. Instant values of any such metric are barely helpful. So, to find meaningful information, we have to find the rate of change of these metrics.
Prometheus-compatible systems provide three functions to find the rate of change of counters:
- rate
- increase
- irate
To use any of the above functions, Prometheus needs at least 2 data points; otherwise, it will return the single point itself. The recommended duration that specifies a sufficient number of data points to be received is four times the scrape interval so that we have at least >= 2 data points. rate is per second average of metric value over the duration specified (for the example, it is [4m], Prometheus finds this value by finding the slope from the start value to the end value for the duration. As Last9 is Prometheus compatible TDSB, same duration is used in the Apdex score calculation.
Getting Started
Follow the quickstart guide for nodejs applications to know more.