Kong
Send distributed traces from Kong to Last9 using OpenTelemetry
Introduction
This guide will help you integrate Kong with Last9 to monitor and improve the observability of your API gateway. This document provides step by step instructions to start collecting traces using Kong's OpenTelemetry plugin.
Prerequisites
- Kong (version 2.0 or above)
- Last9 OpenTelemetry endpoint credentials from the Integrations page
levitate_otlp_endpointlevitate_otlp_auth_header
Enable Distributed Tracing in Kong
-
Enable tracing instrumentation
Set the environment variable
KONG_TRACING_INSTRUMENTATIONS="all"and restart Kong. More Kong configuration options available here. -
Enable the OpenTelemetry Plugin
Add the OpenTelemetry plugin to your Kong configuration file or enable it via the Admin API. Here’s an example of how to enable the plugin globally via the Kong Admin API:
curl -i -X POST http://<kong-admin-url>:8001/plugins \
 --data "name=opentelemetry" \
 --data "config.endpoint=http://<levitate_otlp_endpoint>" \
 --data "config.headers.Authorization=<levitate_otlp_auth_header>" \
--data "config.service_name=kong"infoThe
opentelemetryplugin sends trace to an OpenTelemetry compatible backend such as Last9. -
Verify the Plugin is Enabled
You can verify that the plugin is enabled by checking the Kong logs for trace data being sent to Last9.
tipSet environment variable
KONG_LOG_LEVEL="debug"to verify traces are flowing in correctly to Last9 if needed.
Verify Traces in Last9
- Log in to your Last9 account and navigate to the Grafana dashboard
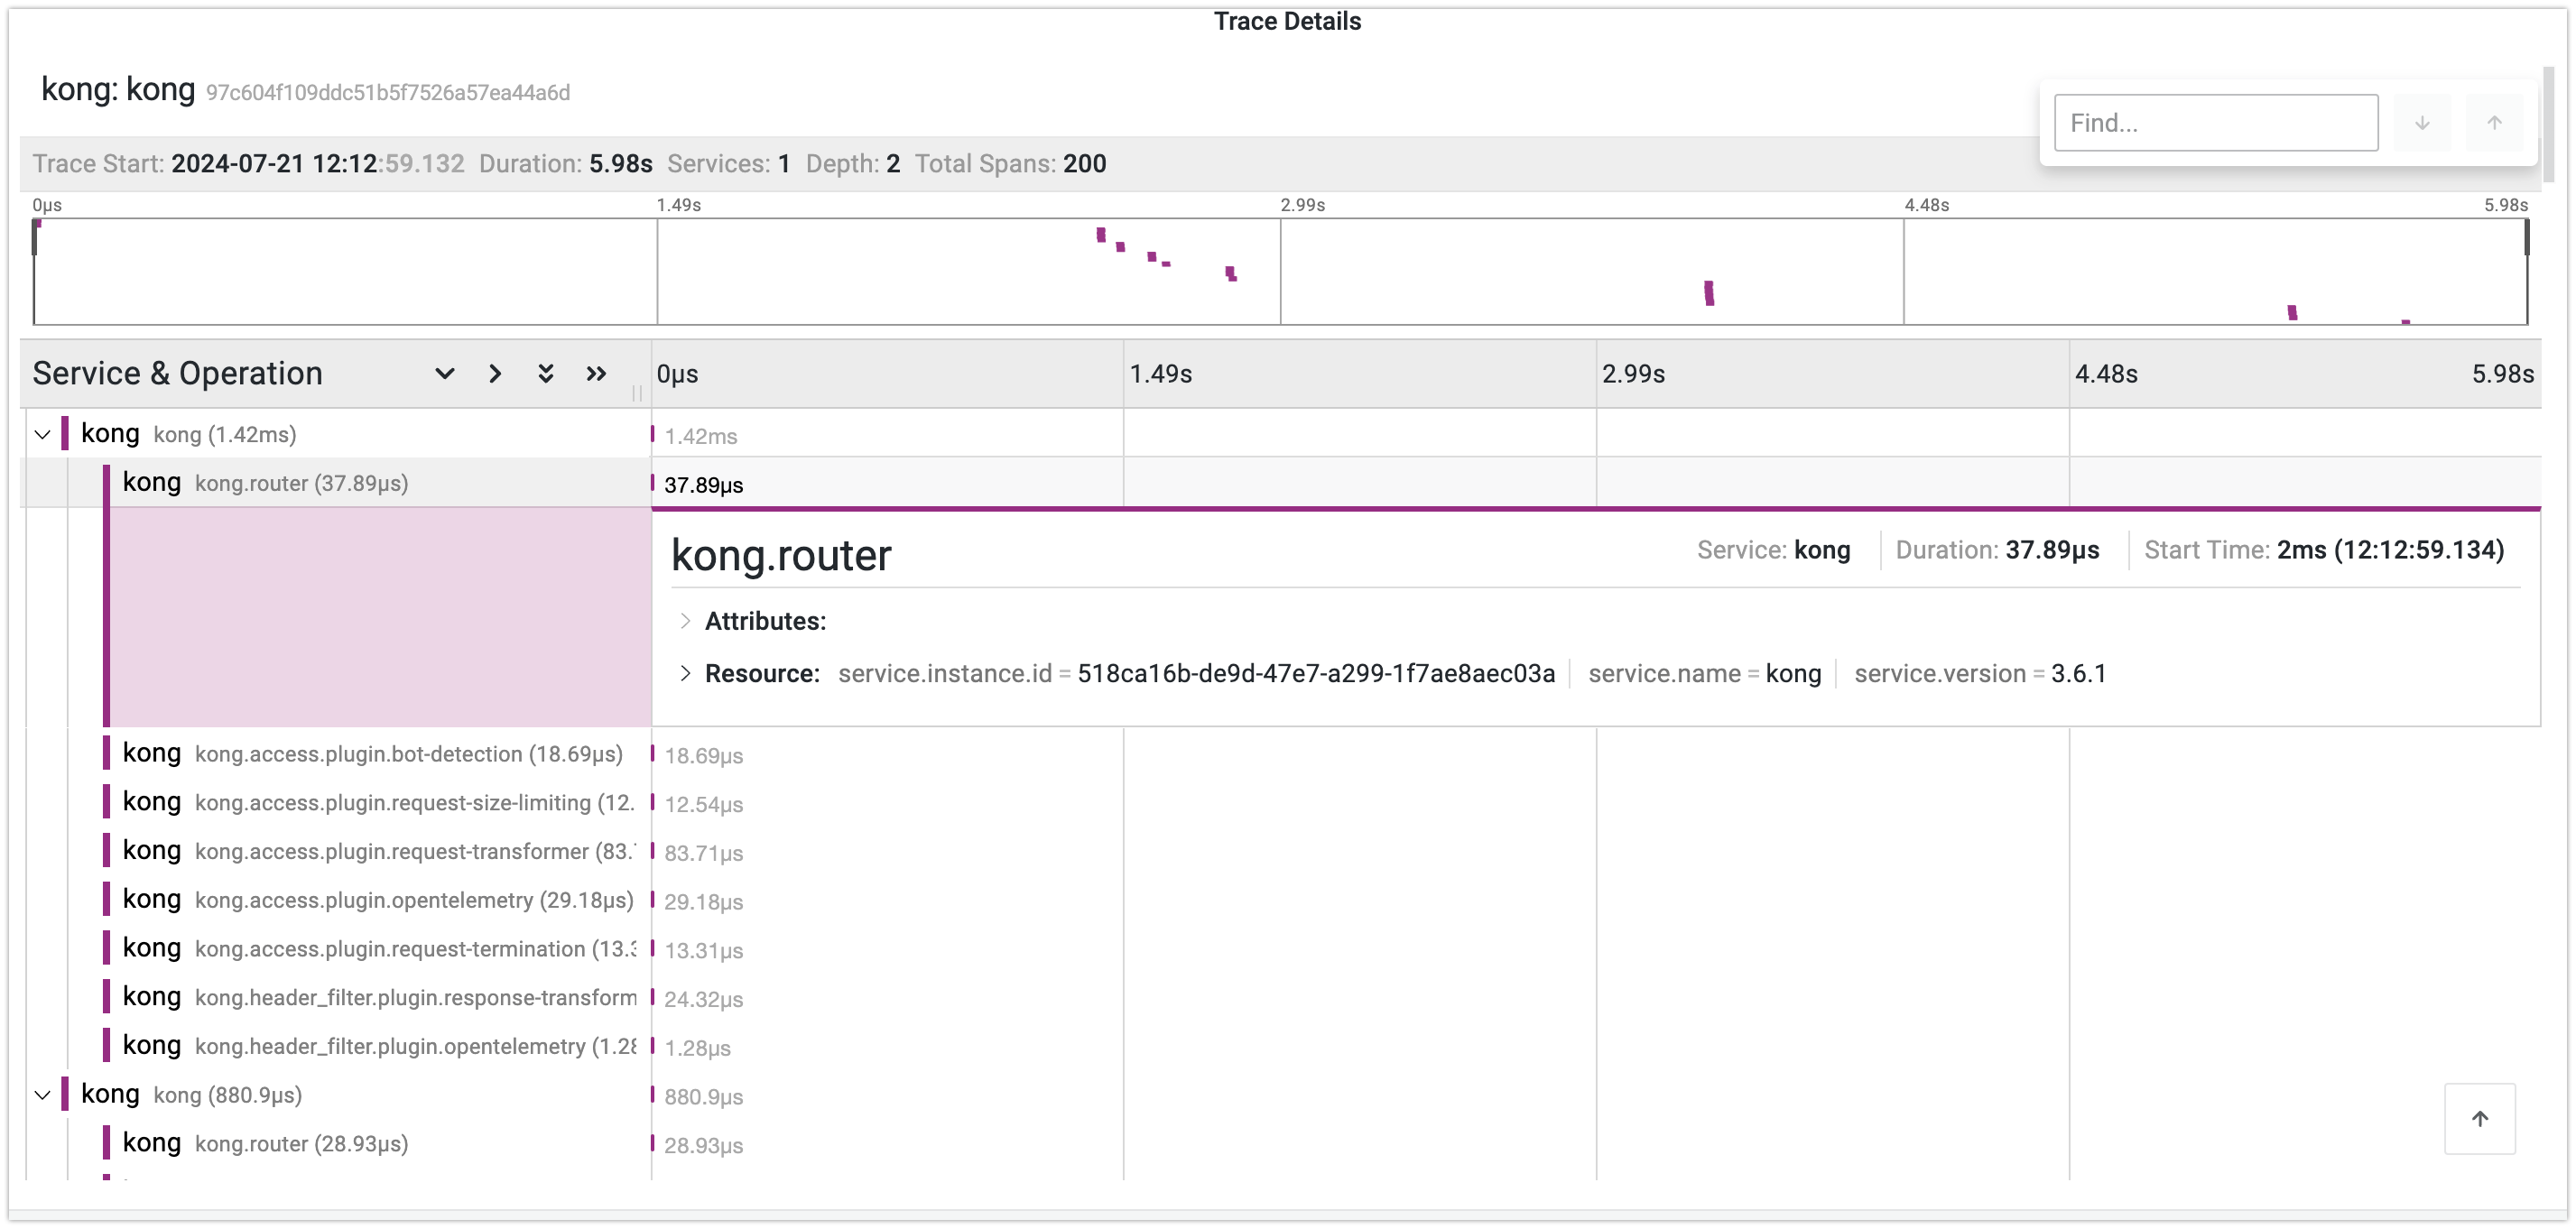
- Navigate to the traces dashboard to see the traces collected from Kong. You should see traces corresponding to your API requests, with detailed information about the request flow and latency
Troubleshooting
Please get in touch with us on Discord or Email if you have any questions.