Confluent Cloud
Send Kafka metrics from Confluent Cloud to Last9 using Prometheus Remote Write
Introduction
This document will showcase how to send Kafka metrics from Confluent
Cloud to Last9 via the vmagent or Prometheus.
Pre-requisites
- You have created a Last9 cluster by following the getting started guide
- You have an active Confluent cloud account
Setup
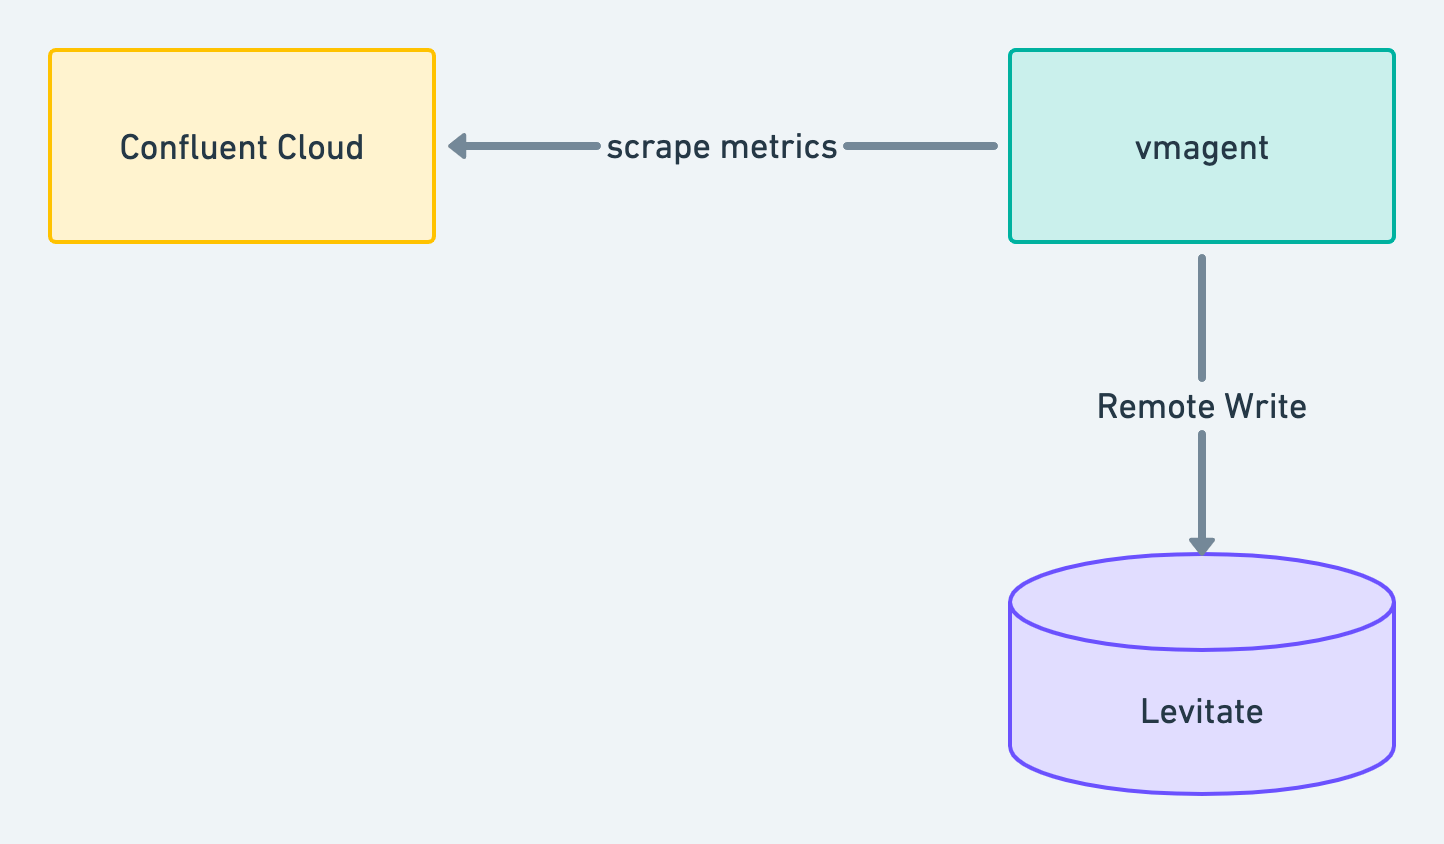
The setup primarily has three components.
- Confluent Cloud, which has the required metrics that you want to send to
Last9. Confluent Cloud exposes metrics on
/exportGET endpoint. vmagentor Prometheus will scrape the metrics from the/exportendpoint and remote write to Last9
The endpoint is as follows:
https://api.telemetry.confluent.cloud/v2/metrics/cloud/export
This endpoint requires a Cloud API key for authentication. The Cloud API key can be created using the Confluent Cloud CLI.
This API endpoint does not export health metrics dataset.
Once you have the key, use it in the vmagent configuration as follows:
scrape_configs:
  - job_name: Confluent Cloud
    scrape_interval: 1m
    scrape_timeout: 1m
    honor_timestamps: true
    static_configs:
      - targets:
          - api.telemetry.confluent.cloud
    scheme: https
    basic_auth:
      username: <Cloud API Key>
      password: <Cloud API Secret>
    metrics_path: /v2/metrics/cloud/export
    params:
      "resource.kafka.id":
        - lkc-1
        - lkc-2
A sample docker-compose forvmagent can be as follows:
version: "3.5"
services:
  vmagent:
    container_name: vmagent
    image: victoriametrics/vmagent
    ports:
      - 8429:8429
    volumes:
      - vmagentdata:/vmagentdata
      - /var/tmp:/var/tmp
      - ./vmagent.yaml:/etc/vmagent/vmagent.yaml
    command:
      - "--promscrape.config=/etc/vmagent/vmagent.yaml"
      - "--remoteWrite.tmpDataPath=/var/tmp/vmagent/"
      - "--remoteWrite.maxDiskUsagePerURL=10737418240"
      - "--remoteWrite.url=$levitate_remote_write_url"
      - "--remoteWrite.basicAuth.username=$levitate_remote_write_username"
      - "--remoteWrite.basicAuth.password=$levitate_remote_write_password"
    restart: always
    network_mode: "host"
volumes:
  vmagentdata: {}
This will start scraping metrics from Confluent Cloud and remote write to Last9.
Find more details on the export metrics API specification of Confluent Cloud here. The doc for all metrics exposed by Confluent Cloud is here.
Next steps
Create a read token for your Last9 Cluster and follow our guide to Configure Grafana to visualize the time series data getting sent to Last9.
Troubleshooting
Please get in touch with us on Discord or Email if you have any questions.