Install VictoriaMetrics VMAgent on Ubuntu
This tutorial walks through setting up VMAgent on Ubuntu as a standalone process and monitor itself.
Introduction
VMAgent is a tiny agent which helps you collect metrics from various sources, relabel and filter the collected metrics and store them in Prometheus compatible remote storage such as Last9 using the Prometheus remote write protocol.
In this tutorial, we’ll cover how to install VMAgent on your Ubuntu server, manage the VMAgent process, and set up scrape configs to collect metrics from VMAgent itself.
Prerequisites
Before you begin this guide, you should have a regular, non-root user with sudo privileges configured on your server and
also basic dependencies such as wget.
Create a Last9 cluster by following the Quick Start Guide.
Keep the following information handy after creating the cluster:
$levitate_remote_write_url- Last9 cluster's Remote write endpoint$levitate_remote_write_username- Cluster ID$levitate_remote_write_password- Write token created for the cluster
Download & extract VMAgent
VMAgent is available in as part of the VictoriaMetrics repository's latest releases.
First obtain the required binary.
$ ARCH=$(uname -m)
case $ARCH in
  x86_64 | amd64)
    ARCH="amd64"
    ;;
  aarch64 | arm64)
    ARCH="arm64"
    ;;
  *)
    echo "Unsupported architecture: $ARCH"
    exit 1
    ;;
esac

$ wget -O /var/tmp/vmutils.tar.gz "https://github.com/VictoriaMetrics/VictoriaMetrics/releases/download/v1.96.0/vmutils-linux-${ARCH}-v1.96.0.tar.gz"
Extract VMAgent from the compressed file i.e /var/tmp/vmutils.tar.gz
$ sudo mkdir -p /opt/vmagent
$ tar -xzf /var/tmp/vmutils.tar.gz -C /opt/vmagent
Setup VMAgent scrape config
Create a scrape config in the same directory as the VMAgent binary.
$ sudo cat > /opt/vmagent/vmagent.yaml <<EOL
global:
  scrape_interval: 1m
  external_labels:
    via_cluster: 'ec2-vmagent'

scrape_configs:
  - job_name: "vmagent"
    static_configs:
      - targets: ["localhost:8429"]
EOL
This adds the VMagent itself as a static target so that VMAgent can be monitored. Additional scrape targets can be
added. The complete list of options in the scrape_config section can be
found here.
We have included a external label ec2-vmagent to identify all metrics that this vmagent scrapes. This is important for
troubleshooting purposes to verify if the remote storage is receiving metrics with the aforementioned label.
Run VMAgent as a standalone service
Define a service using the below command. Ensure that you replace the placeholder values for remote write URL, username and password with the correct values as described in the prerequisites section.
$ sudo cat >/etc/systemd/system/vmagent.service <<EOL
[Unit]
Description=vmagent

[Service]
ExecStart=/opt/vmagent/vmagent-prod --promscrape.config=/opt/vmagent/vmagent.yaml --remoteWrite.tmpDataPath=/var/tmp/vmagent/tmp/ --remoteWrite.maxDiskUsagePerURL=10737418240 --remoteWrite.url="$levitate_remote_write_url" --remoteWrite.basicAuth.username="$levitate_remote_write_username" --remoteWrite.basicAuth.password="$levitate_remote_write_password"
Restart=always

[Install]
WantedBy=multi-user.target
EOL
Now we'll reload systemd and start the service
$ sudo systemctl daemon-reload
$ sudo systemctl enable vmagent
$ sudo systemctl start vmagent
Verification
Check the status of our service by running the below command and if all is well then we should see the below output as well.
$ sudo systemctl status vmagent
ubuntu@ip-10-9-175-233:~$ sudo systemctl status vmagent
● vmagent.service - vmagent
     Loaded: loaded (/etc/systemd/system/vmagent.service; enabled; vendor preset: enabled)
     Active: active (running) since Thu 2023-05-11 10:08:09 UTC; 42s ago
   Main PID: 12890 (vmagent-prod)
      Tasks: 7 (limit: 1141)
     Memory: 15.7M
        CPU: 78ms
     CGroup: /system.slice/vmagent.service
             └─12890 /opt/vmagent/vmagent-prod --promscrape.config=/opt/vmagent/vmagent.yaml --remoteWrite.tmpDataPath=/var/tmp/vmagent/tmp/ --remoteWrite.maxDiskUsagePerURL=10737418240 --remoteWrite.url=masked --remoteWrite.basicAuth.username=masked --remoteWrite.basicAuth.password=masked

May 11 10:08:09 ip-10-9-175-233 vmagent-prod[12890]: 2023-05-11T10:08:09.273Z        info        VictoriaMetrics/lib/persistentqueue/fastqueue.go:60        opened fast persistent queue at "/var/tmp/vmagent/tmp/persistent-queue/1_73580056731B6C96" with maxInmemoryBlocks=200, it contains 0 pending bytes
May 11 10:08:09 ip-10-9-175-233 vmagent-prod[12890]: 2023-05-11T10:08:09.412Z        info        VictoriaMetrics/app/vmagent/remotewrite/client.go:162        the remote storage at "1:secret-url" doesn't support VictoriaMetrics remote write protocol. Switching to Prometheus remote write protocol. See https://docs.victoriametrics.com/vmagent.html#victoriametrics-remote-write-protocol
May 11 10:08:09 ip-10-9-175-233 vmagent-prod[12890]: 2023-05-11T10:08:09.413Z        info        VictoriaMetrics/app/vmagent/remotewrite/client.go:199        initialized client for -remoteWrite.url="1:secret-url"
May 11 10:08:09 ip-10-9-175-233 vmagent-prod[12890]: 2023-05-11T10:08:09.415Z        info        VictoriaMetrics/app/vmagent/main.go:145        started vmagent in 0.156 seconds
May 11 10:08:09 ip-10-9-175-233 vmagent-prod[12890]: 2023-05-11T10:08:09.415Z        info        VictoriaMetrics/lib/promscrape/scraper.go:113        reading Prometheus configs from "/opt/vmagent/vmagent.yaml"
May 11 10:08:09 ip-10-9-175-233 vmagent-prod[12890]: 2023-05-11T10:08:09.415Z        info        VictoriaMetrics/lib/httpserver/httpserver.go:96        starting http server at http://127.0.0.1:8429/
May 11 10:08:09 ip-10-9-175-233 vmagent-prod[12890]: 2023-05-11T10:08:09.415Z        info        VictoriaMetrics/lib/httpserver/httpserver.go:97        pprof handlers are exposed at http://127.0.0.1:8429/debug/pprof/
May 11 10:08:09 ip-10-9-175-233 vmagent-prod[12890]: 2023-05-11T10:08:09.418Z        info        VictoriaMetrics/lib/promscrape/config.go:121        starting service discovery routines...
May 11 10:08:09 ip-10-9-175-233 vmagent-prod[12890]: 2023-05-11T10:08:09.418Z        info        VictoriaMetrics/lib/promscrape/config.go:127        started service discovery routines in 0.000 seconds
May 11 10:08:09 ip-10-9-175-233 vmagent-prod[12890]: 2023-05-11T10:08:09.418Z        info        VictoriaMetrics/lib/promscrape/scraper.go:427        static_configs: added targets: 2, removed targets: 0; total targets: 2
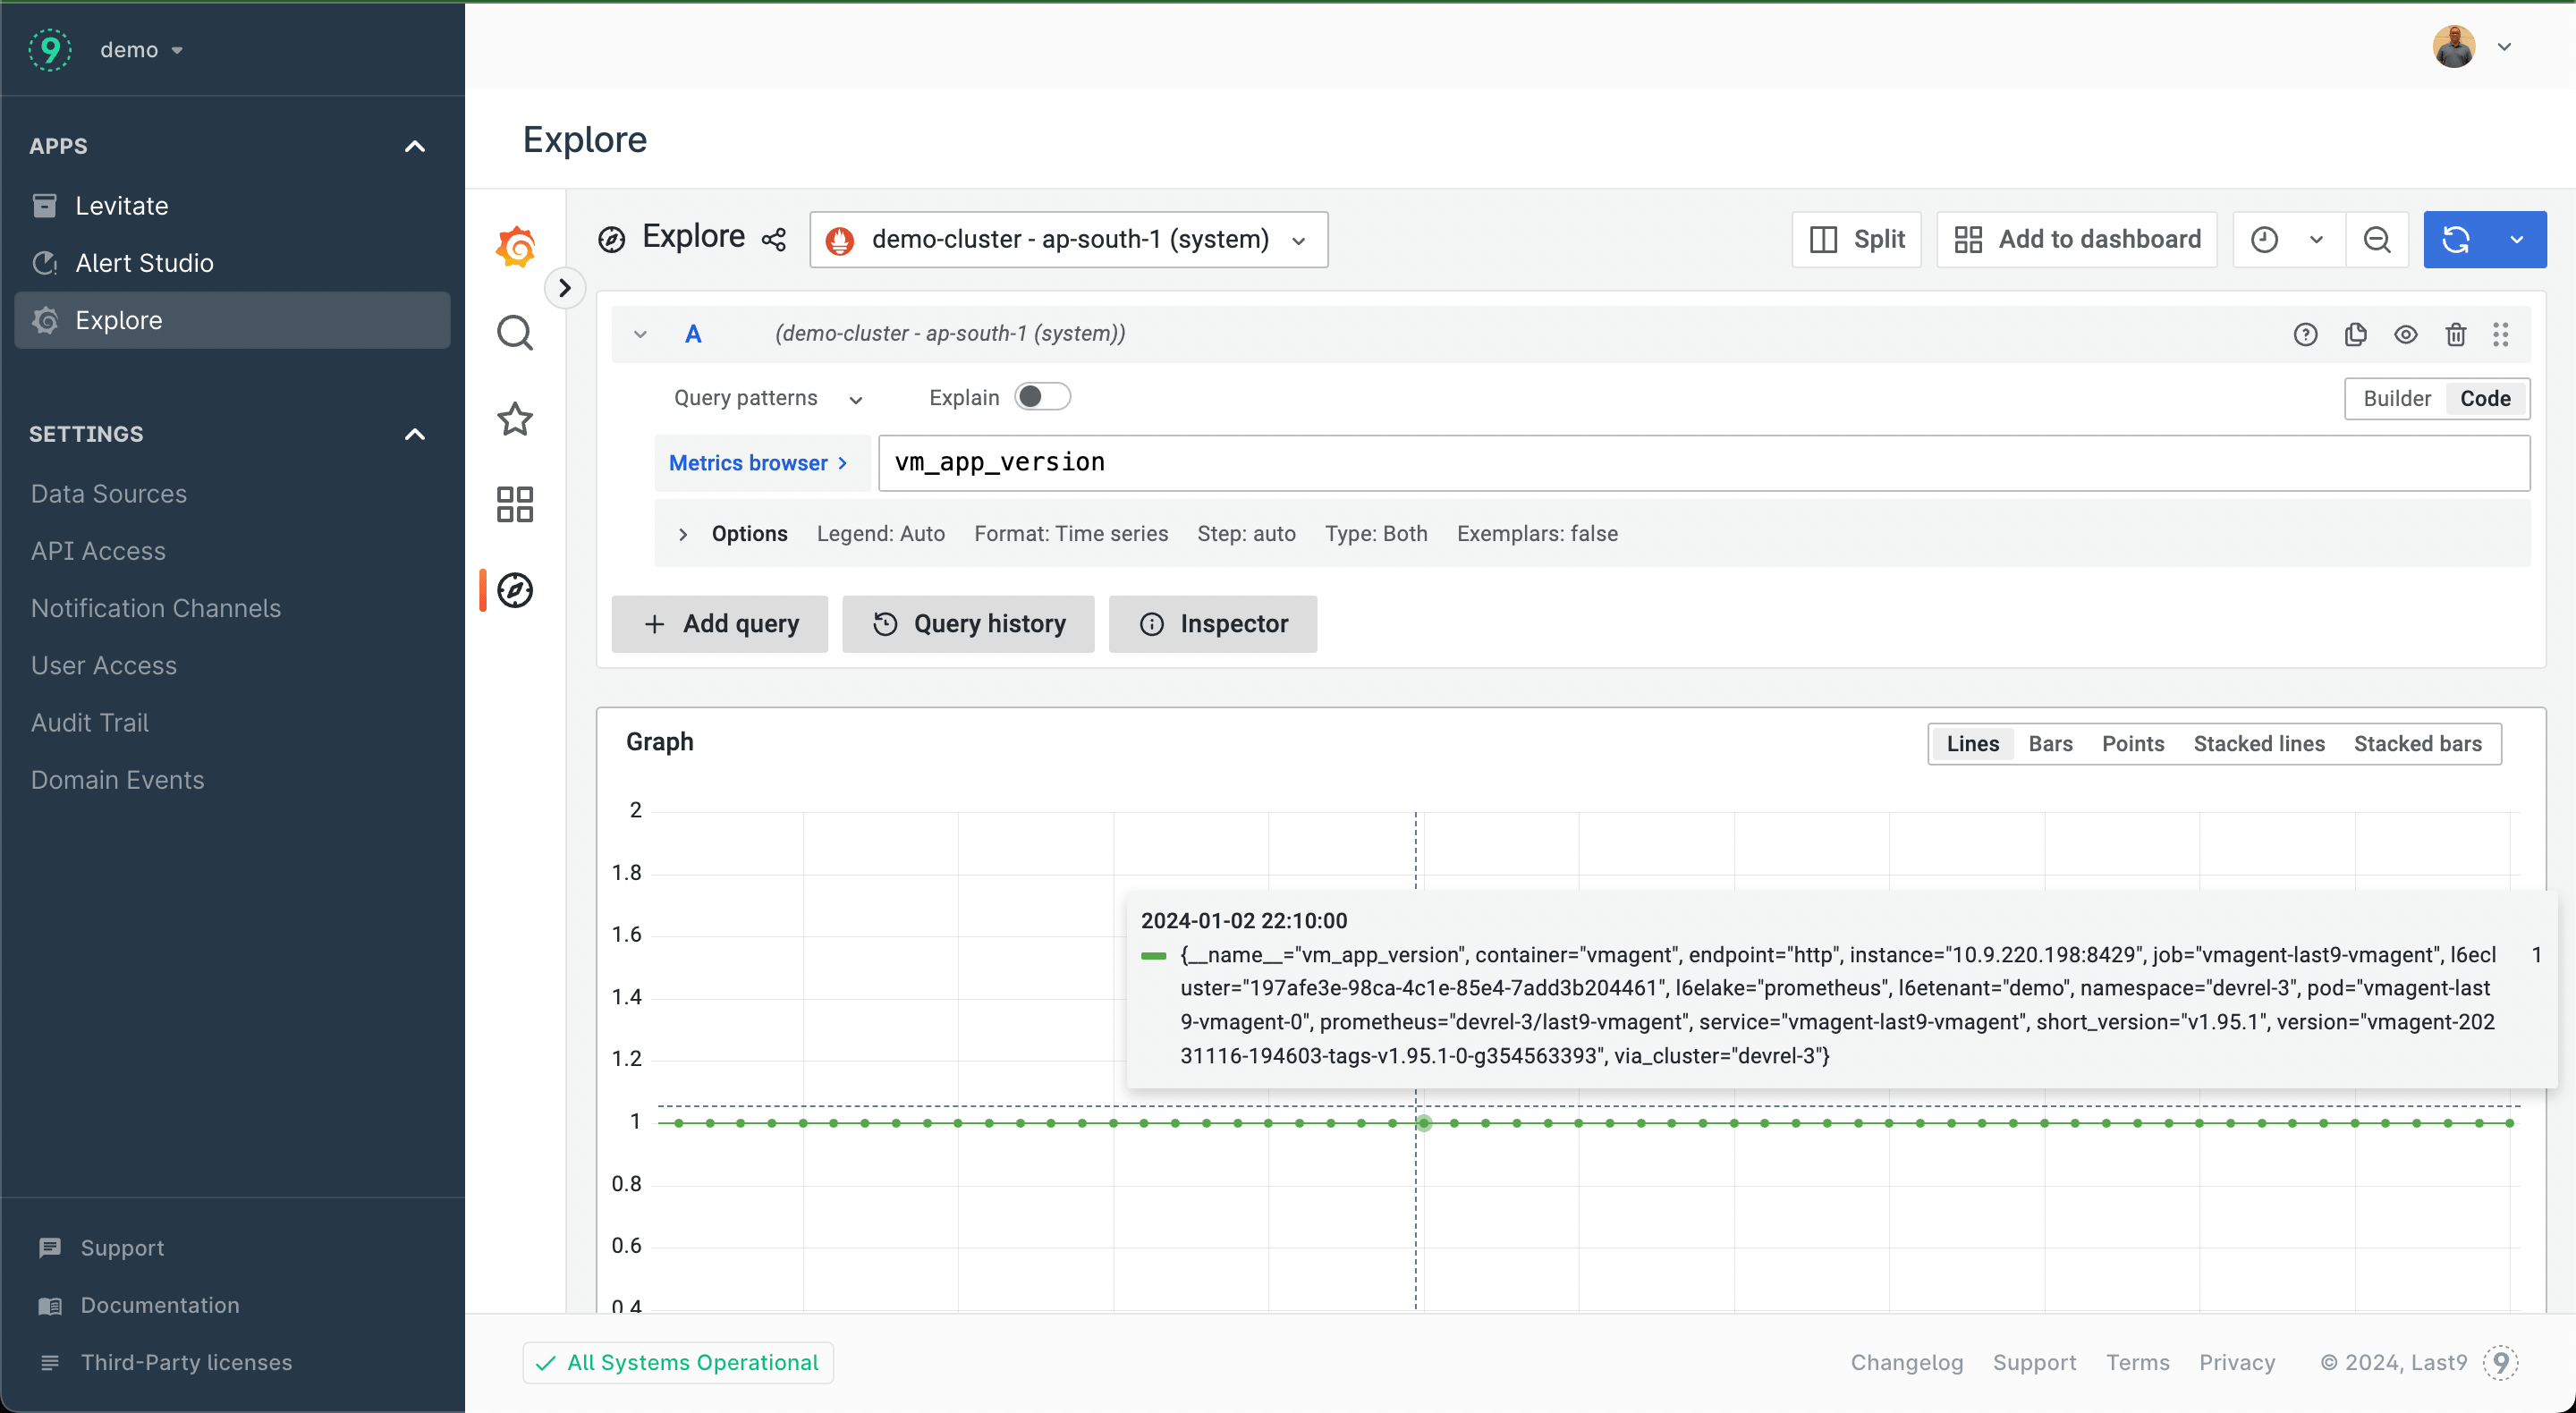
Visit the Embedded Grafana dashboard in Last9, select the cluster where you have configured the VMAgent to send the
data and query the following metric vm_app_version{via_cluster="ec2-vmagent"}. The value will be 1 if the ingestion
is happening correctly.