Getting Started with Events
This document explains how to send events to Last9 and different ways to consume them such as via streaming aggregation.
Last9 time series data warehouse is a powerful tool for storing and analyzing time series data. Last9 also supports ingesting real-time events and converting them into metrics so that they can be consumed in myriad ways engineers are already familiar with.
This document outlines the steps necessary to send events to Last9 and the different ways of consuming them.
Events
Generally, there are two types of events.
- They happen over time, and their performance, like frequency, presence, or absence, is interesting
- Example: Average hourly take-offs from the San Francisco Airport in the last week.
- The event and its data are of interest
- Example: When was the last time Arsenal won in EPL?
The first example is asking questions based on specific aggregations performed on raw events, the individual events may not be necessary, but their aggregations and insights captured using them are relevant for business.
The second example is about the event and gives insights based on the event data.
Last9 supports extracting both kinds of information from the events.
Structure of Events
Last9 supports accepting events in the following JSON format. Every event has
a unique name defined by the event key and a list of properties. Any extra
keys apart from event and properties are not retained by Last9.
{
  "event": "heartbeat",
  "properties": {
    "server": "ip_address",
    "environment": "staging"
  },
  "extra_fields": "will be dropped"
}
Sending Events to Last9
Prerequisites
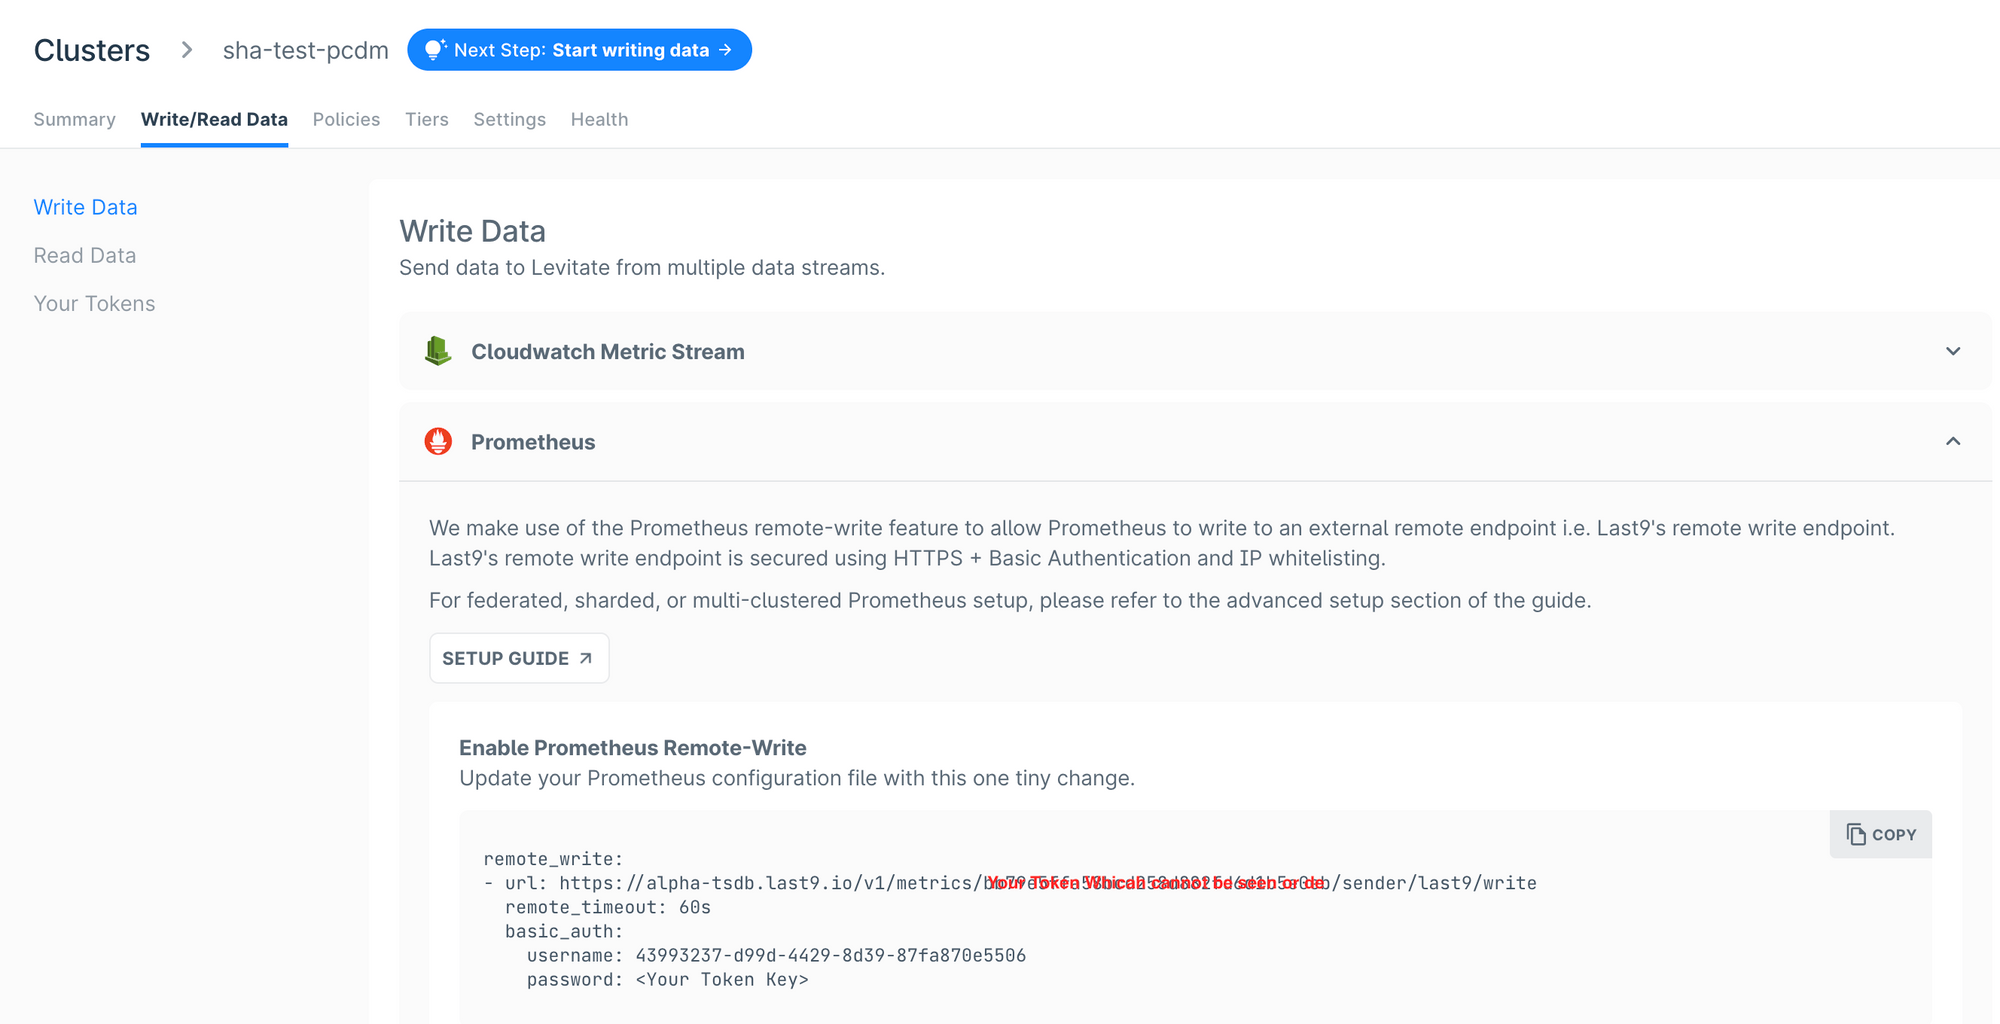
Grab the Prometheus Remote Write URL, cluster ID, and the write token of the Last9 cluster, which you want to use as an Event store.
Follow the instructions here if you haven't created the cluster and its write token.
Sending data
Grab the Prometheus Remote Write URL for your Last9 Cluster, and make following changes to the URL.
If your Prometheus URL is
https://username:token@app-tsdb.last9.io/v1/metrics/{uuid}/sender/acme/write
The Event URL would be
https://username:token@app-events-tsdb.last9.io/v1/events/{uuid}/sender/acme/publish
Note down the table below to get the hostname for the Events gateway depending on the region in which the Last9 cluster exists.

| Cluster Region | Host |
|---|---|
| Virginia us-east-1 | app-events-tsdb-use1.last9.io |
| India ap-south-1 | app-events-tsdb.last9.io |
Events must be sent with the Content-Type: application/json header.
curl --location --request XPOST 'https://username:token@app-events-tsdb.last9.io/v1/events/{uuid}/sender/acme/publish' \
--header 'Content-Type: application/json' \
--data-raw '[{
	"event": "sign_up",
	"properties": {
		"currentAppVersion": "4.0.1",
		"deviceType": "iPhone 14",
		"dataConnectionType": "wifi",
		"osType": "iOS",
		"platformType": "mobile",
		"mobileNetworkType": "wifi",
		"country": "US",
        "state": "CA"
	}
}]'
The API endpoint accepts an array of events in the payload so one or more events can be sent in the same packet. The API is greedy and allows partial ingestion. If one or more events in the packet have a problem, they are returned to the response body; everything else is ingested into the system.
Consuming events as metrics
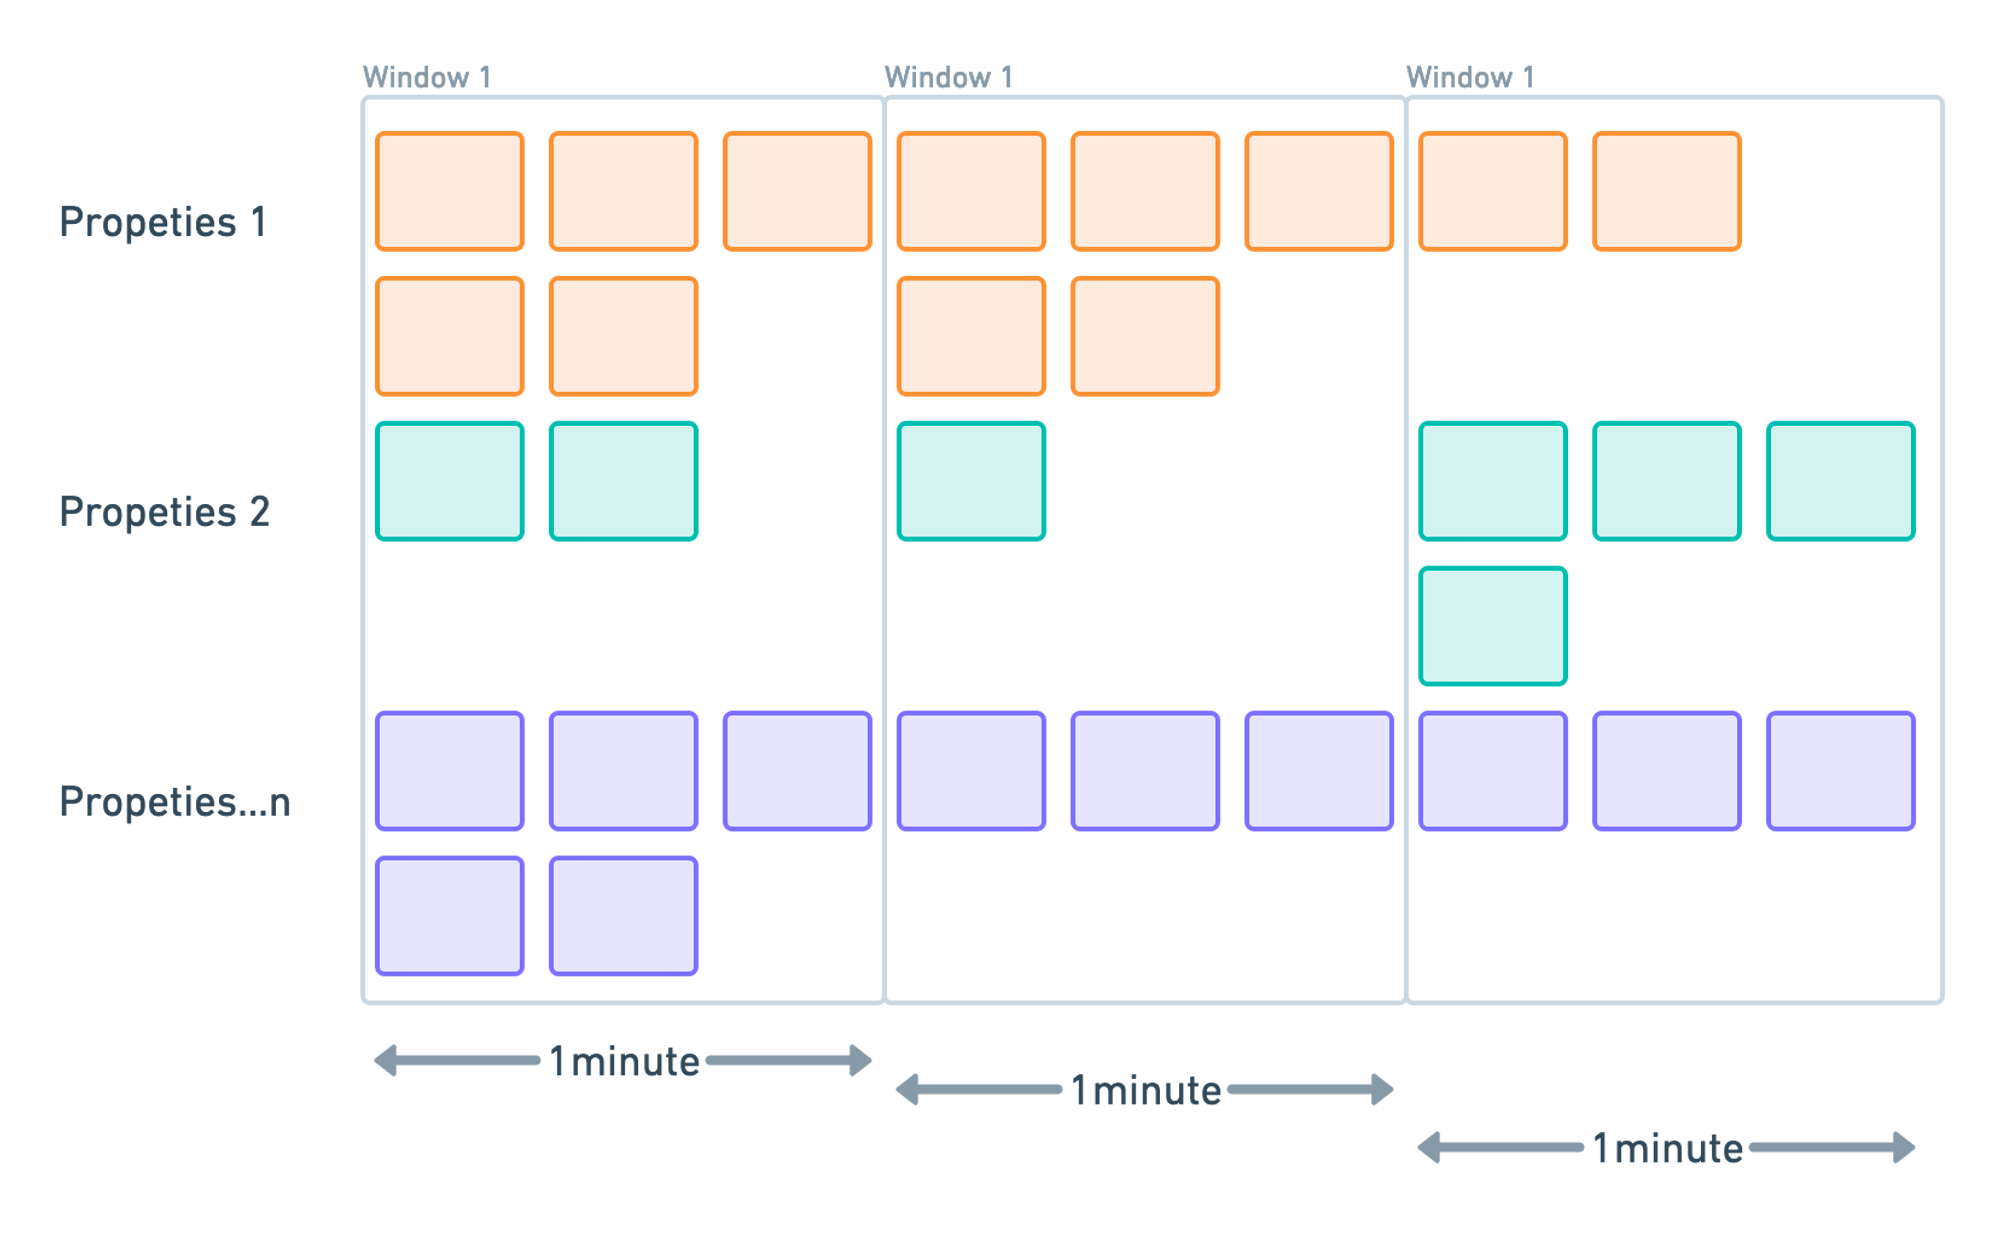
Events are converted to Metrics at 1 DPM (Data Point per minute) and combined to
emit gauges per combinations of event name + properties for the previous
minute.
We use Tumbling Windows to represent the Event stream's consistent and disjoint time intervals. All published events are partitioned into buckets of 1 minute each and then grouped by event Name and properties.
For example, the elements with timestamp values \[0:00:00-0:01:00) are in the
first window. Elements with timestamp values \[0:01:00-0:02:00) are in the
second window. And so on.

The following events will produce the following metrics:
event_name_count{properties...1} <ts1> 5
event_name_count{properties...2} <ts1> 2
...
event_name_count{properties...n} <ts1> 5

event_name_count{properties...1} <ts2> 5
event_name_count{properties...2} <ts2> 1
...
event_name_count{properties...n} <ts2> 3

event_name_count{properties...1} <ts2> 2
event_name_count{properties...2} <ts2> 4
...
event_name_count{properties...n} <ts2> 3
Define Streaming Aggregations
You need to define streaming aggregations to query the metrics converted from events. Last9 allows defining a Streaming Aggregation as a PromQL to emit an aggregated metric that alerts or dashboards can then consume.
- promql: "sum(device_health_total{version='1.0.1'})[5m] by (os)"
  as: total_devices_by_os_5m
  with_name: total

- promql: "sum(device_health_total{os='ios'})[1m] by (version)"
  as: concurrency_by_ios_version
  with_name: concurrency
Please refer to the PromQL-powered Streaming Aggregations to understand the workflow of where and how to define the Streaming Aggregation Pipelines.
This feature enables the folding of all metrics that would otherwise explode in cardinality and allows for the emission of meaningful aggregations and views. It is also available for Last9 Metrics, not just limited to Events.
Events to Gauge Metrics
Consider an event named memoryUsageSpikeAlert with the following properties:
increaseInBytesindicating an increase in memory usage by 1,610,612,736 byteshostrepresents the host's IP address associated with the eventosTypespecifying the operating system type as "linux"
{
    "event": "memoryUsageSpikeAlert",
    "properties":  {
        "increaseInBytes": "1610612736",
        "host": "10.1.6.14",
        "osType": "linux"
    }
}
Define the streaming aggregation configuration for max of
memoryUsageSpikeAlert as follows:
- promql: "max by (host) (memoryUsageSpikeAlert_maximum)"
  as: "max_memory_usage_spike"
  with_value: "increaseInBytes"
  with_name: "maximum"
Let’s break the example:
maxis the aggregation functionmaximumis thewith_namevalue appended to the intermediate metric name to maintain uniqueness. It can be any string.with_valueis the event’s property name on which the gauge aggregation has to be applied. In this case, it isincreasedBytes.max_memory_usage_spikewill be the final output metric you are exposed to query against.
You can also use the
minandsumaggregations.
Querying Events
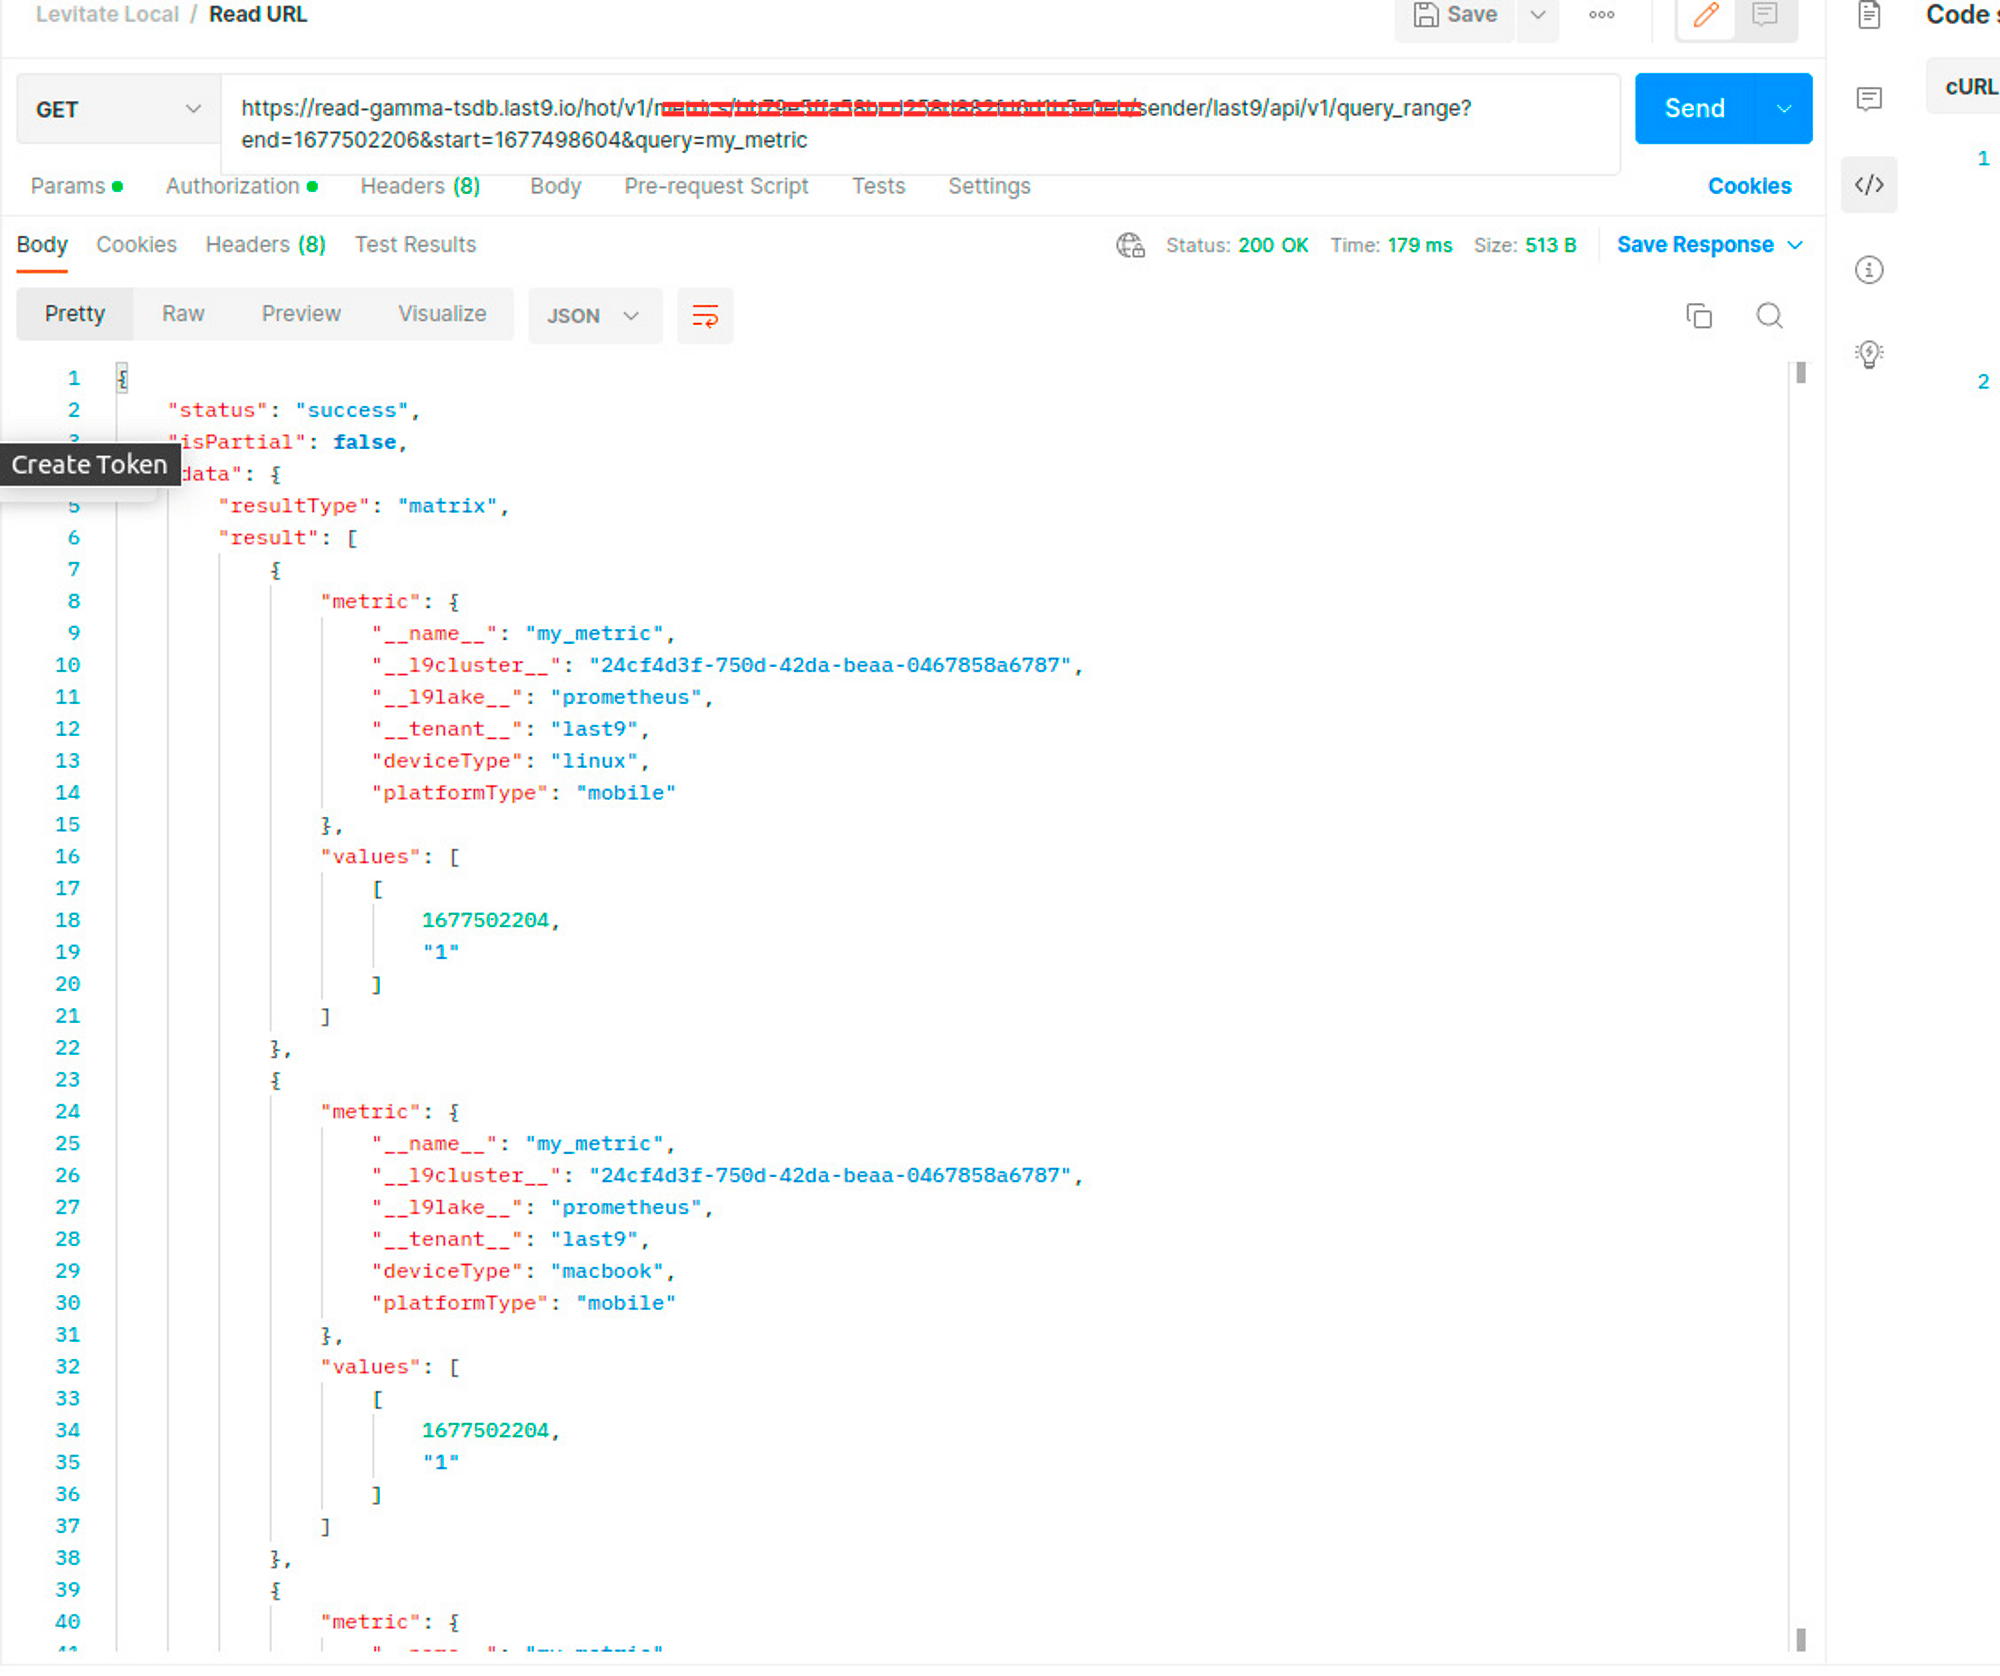
Once Events have been converted to Metrics, they can be queried like metrics. This could be a Grafana Dashboard or any other Prometheus Query API client.

You may also set alerts on these events, converted to metrics, using Prometheus-compatible Alertmanager.
Conclusion
Here’s a link to the sample repository that brings this all together. It contains some example schemas and aggregation pipelines.
https://github.com/last9/levitate-events-integration-example
FAQs
Q: Why is time not accepted as a first-class property?
A: Accepting a User-provided timestamp is extremely risky. A timestamp may not be formatted correctly, or instead of a UnixMilli, one may send Unix alone. Or send January 1st, 1970 as testing data. Such precision is unfair to expect from developers who want easier integration that is not prone to fragility. Besides, since the system is optimized for time, a malformed timestamp will result in undesired results of dropped packets or the system having to backfill data in frozen shards. Hence, we accept timestamps as when the event is received. This also means that Last9 works well with real-time events!
Q: What happens to the timestamp if there are delays in arrival?
A: Last9 Gateways are designed to be extremely fast and lightweight. They write data as early as they receive it and are highly available across multiple availability zones. They need more processing to ensure messages are not lost or delayed upon arrival.
Troubleshooting
Please get in touch with us on Discord or Email if you have any questions.