statsD
This document describes the ways in which a user can send ship metrics via statsD to Last9.
Introduction
statsD is one of the oldest and most common ways to ship your application or infra metrics to a backend time series database like Graphite, InfluxDB, etc.
statsD comprises 3 basic concepts:
- client: usually a client library that instruments an application to send metrics e.g. statsd-kafka
- server: the statsd daemon accepting metrics from the
client - backend: TSDB accepting metrics from the
server
Pre-requisites
- You have created a Last9 cluster by following the getting started guide and have the following info:
- Remote write endpoint URL =
$LEVITATE_REMOTE_WRITE_URL - Remote write username =
$LEVITATE_REMOTE_WRITE_USERNAME - Remote write password =
$LEVITATE_REMOTE_WRITE_PASSWORD
- Remote write endpoint URL =
- Clone last9-integrations GitHub repo which contains the sample code
statsD graphite backend method (recommended)
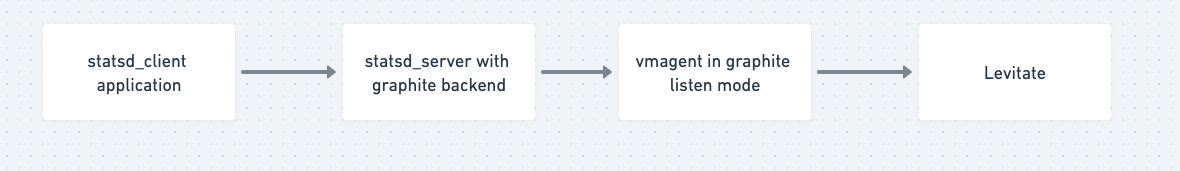
statsd_client_applicationpushes metrics tostatsd_serverstatsd_serverhas enabled built in backend Graphitevmagentlistens on port 2003 to accept metrics in Graphite formatvmagentremote writes these metrics to Last9/
A complete example using this approach can be found here.
This is our recommended approach for pushing statsd metrics to Last9.
Relay method
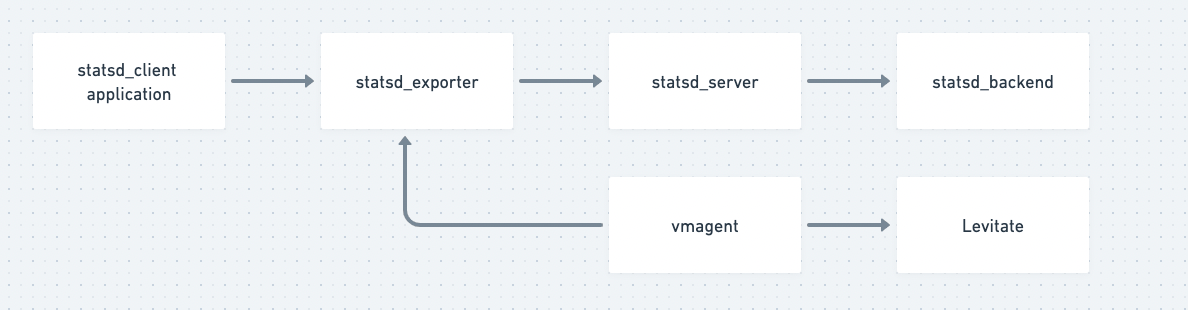
statsd_client_applicationpushes metrics tostatsd_exporterstatsd_exportertransparently relays the metrics to existingstatsd_server, which writes them to thestatsd_backende.g. Graphite, InfluxDb.statsd_exporterexposes the metrics on a/metricsportvmagentscrapes these metrics and remote writes them to Last9
A complete example using this approach can be found here
Repeater method
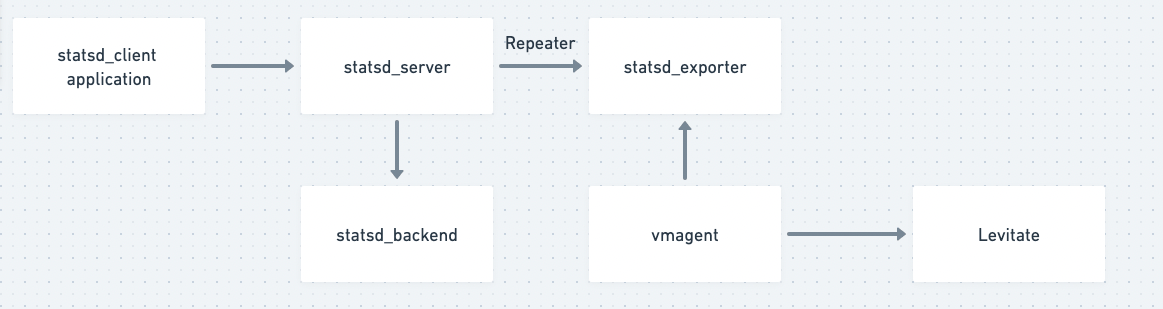
- statsd_application pushes metrics to statsd_server
- statsd_server enables
repeater mode
to push metrics to existing
statsd_backendandstatsd_exporter statsd_exporterexposes metrics on/metricsvmagentscrapes these metrics and remote writes them to Last9
A complete example using this approach can be found here
Comparison
| Approach | Pros | Cons |
|---|---|---|
| Graphite backend | vmagent can push metrics to Last9, no config changes to the applicaiton | Requires changing statsd config |
| Relay | No config changes to the statsd. | Requires changing application config. |
| Repeater | No config changes to the application. | Requires changing statsd config. |
Next steps
Create a read token for your Last9 Cluster and follow our guide to Configure Grafana to visualize the time series data getting sent to Last9.
Troubleshooting
Please get in touch with us on Discord or Email if you have any questions.