jmxtrans
How to send metrics from Java-based applications to Last9 using jmxtrans
Introduction
jmxtrans is one of the common tools used to extract metrics from JVM via JMX and translate them into a variety of output metric formats e.g. statsd, telegraf, etc.
This document will showcase how to use your existing jmxtrans setup to emit
metrics to Last9.
Pre-requisites
- You have created a Last9 cluster by following the getting started guide
- Clone last9-integrations GitHub repository contains the sample code with different approaches discussed in this article
Setup
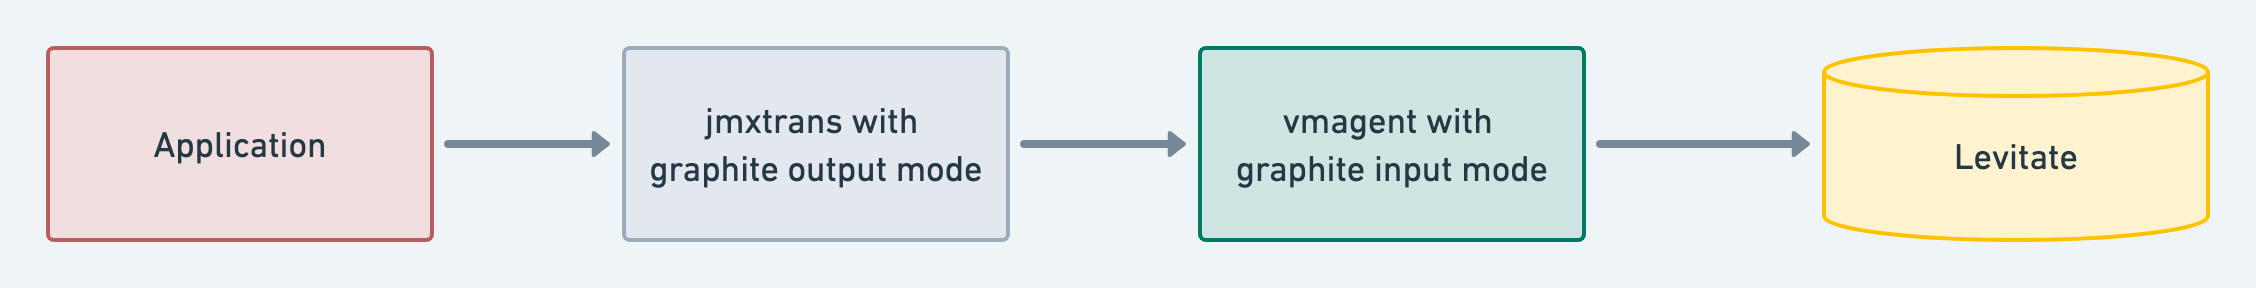
The setup primarily has 3 components:
- The Java Application is the application under observation for monitoring. It exposes a JMX interface
- A
jmxtranscontainer queries thejmxendpoint exposed by the Java application for metrics and converts them into graphite output format. These metrics are pushed tovmagent vmagentreads the data in the graphite format converts it into Prometheus-compatible format and remote writes to Last9
A complete example using this approach can be found here.
Next steps
Create a read token for your Last9 Cluster and follow our guide to Configure Grafana to visualize the time series data getting sent to Last9.
Troubleshooting
Please get in touch with us on Discord or Email if you have any questions.