Logs Explorer
Use Last9's native UI for logs with first-class search and filters — quickly view related logs, traces, and metrics by clicking on any log line.
Using Logs Explorer
You can start exploring logs by visiting Logs Explorer in Last9. The Log Explorer allows to filter logs by specific log attributes and resource info to slice and dice by various log dimensions, and view correlated telemetry.
Builder Mode

Last9 provides a native experience to explore your logs without using any query language.
- Search:
- With auto-complete support,
service,severity, andbodyare first-class attributes - Supported operators are
equal,not equal,contains, anddoes not contain - Edit the same attribute chip to add multiple values
- With auto-complete support,
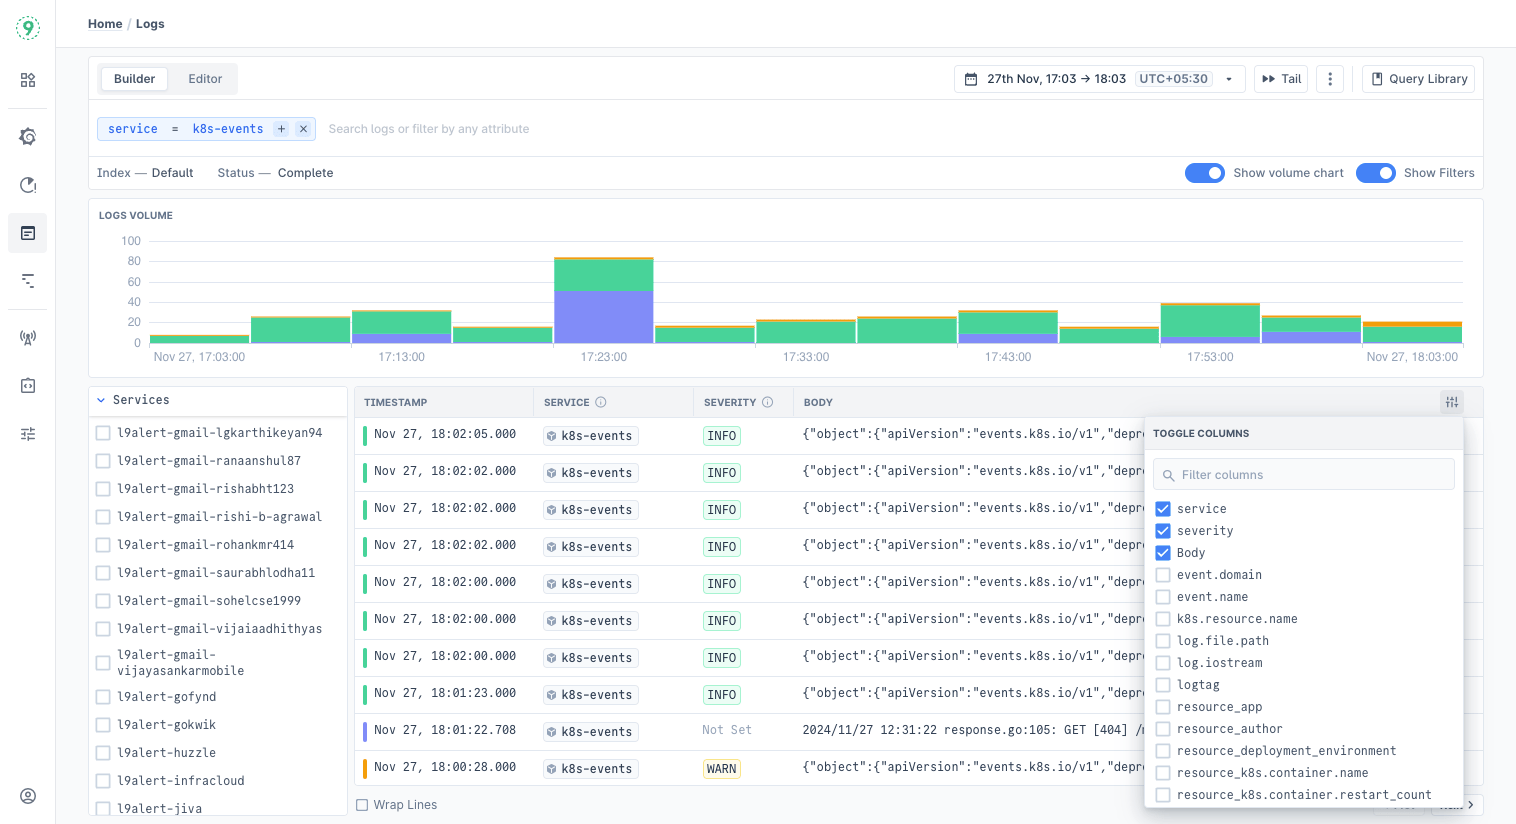
- Filters: Apart from severity and service, attributes and resources from the log lines in the selected time window are also listed. Click on
onlyorallnext to a filter item for quick actions. - Live Tail: A live stream of logs matching any filters, if applied. Useful to debug any instant changes to while deploying, etc. We recommened applying filters to narrow the scope of the Live Tail, which also helps improve the overall performance.
- Time Picker: Select an absolute or relative time range. You can also switch between timezones.
- Volume Chart: A stacked bar chart for the selected time window, color-coded to severity of the log lines.
- Toggle Columns: Click on the settings icon on the top right of the table to add dynamic columns based on log attributes.
Editor Mode

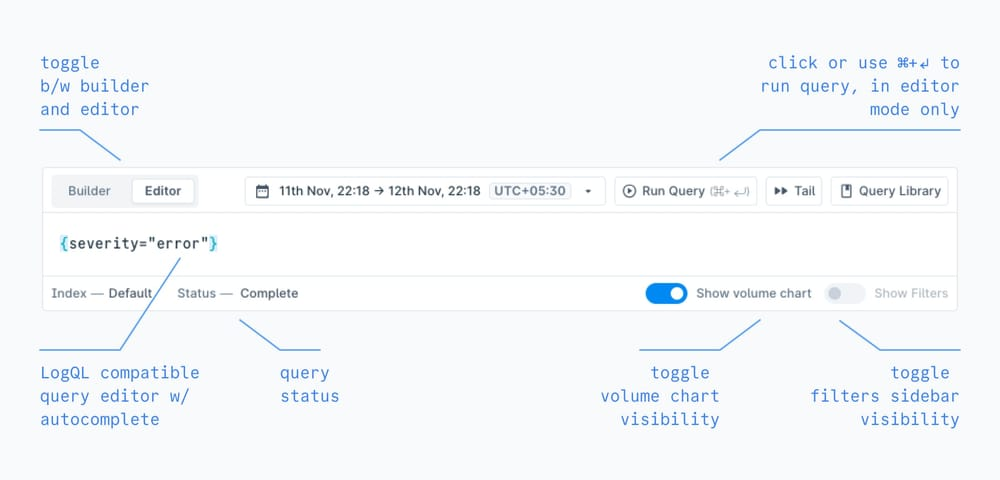
You can write complex queries, with aggregations, that are fully LogQL-compatible using the Editor mode.
- LogQL auto-completion is supported. Auto-complete for aggregation functions is WIP.
- Aggregation queries are visualized as timeseries instead of as a volume bar chart.
- Switching from Builder to Editor will convert any existing search to LogQL, but not vice versa.
- Queries in Editor mode are not auto-run. Please click on the Run Query button or use the cmd/alt + enter keyboard shortcut.
Log Details

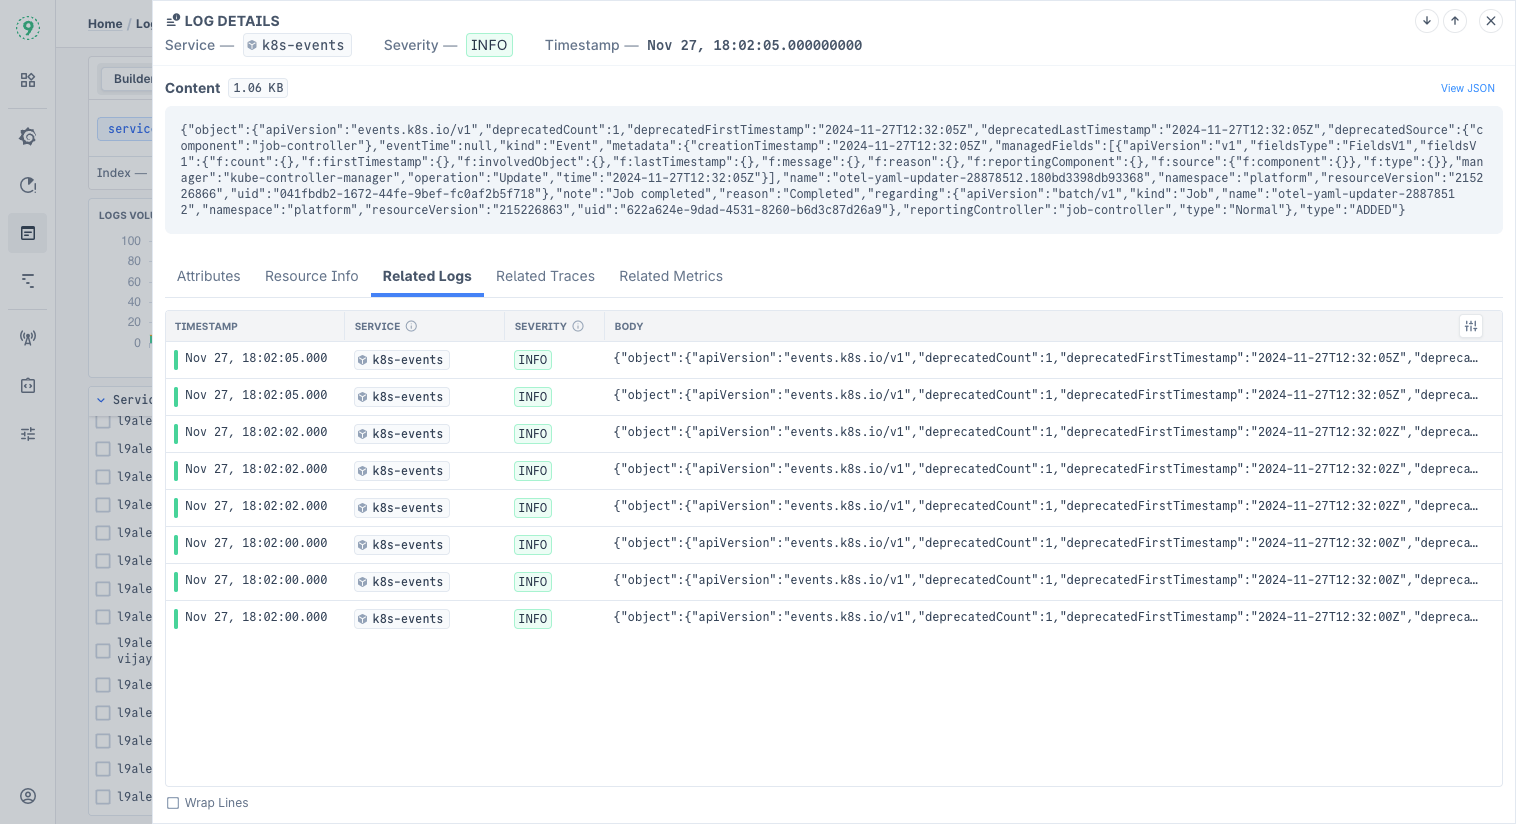
Clicking on a log line in Logs Explorer opens a side panel with additional context and information about the selected log line.
- Content, with payload size and option to view as raw or JSON
- Attributes of the selected log line
- Resource Info of the selected log line
- Related Logs, based on the service and other attributes of the selected log line
- Related Traces, based on the service and other attributes of the selected log line
- Related Metrics, visualizing CPU and memory utilization of the relevant container, instance, and pod resources
Query Library

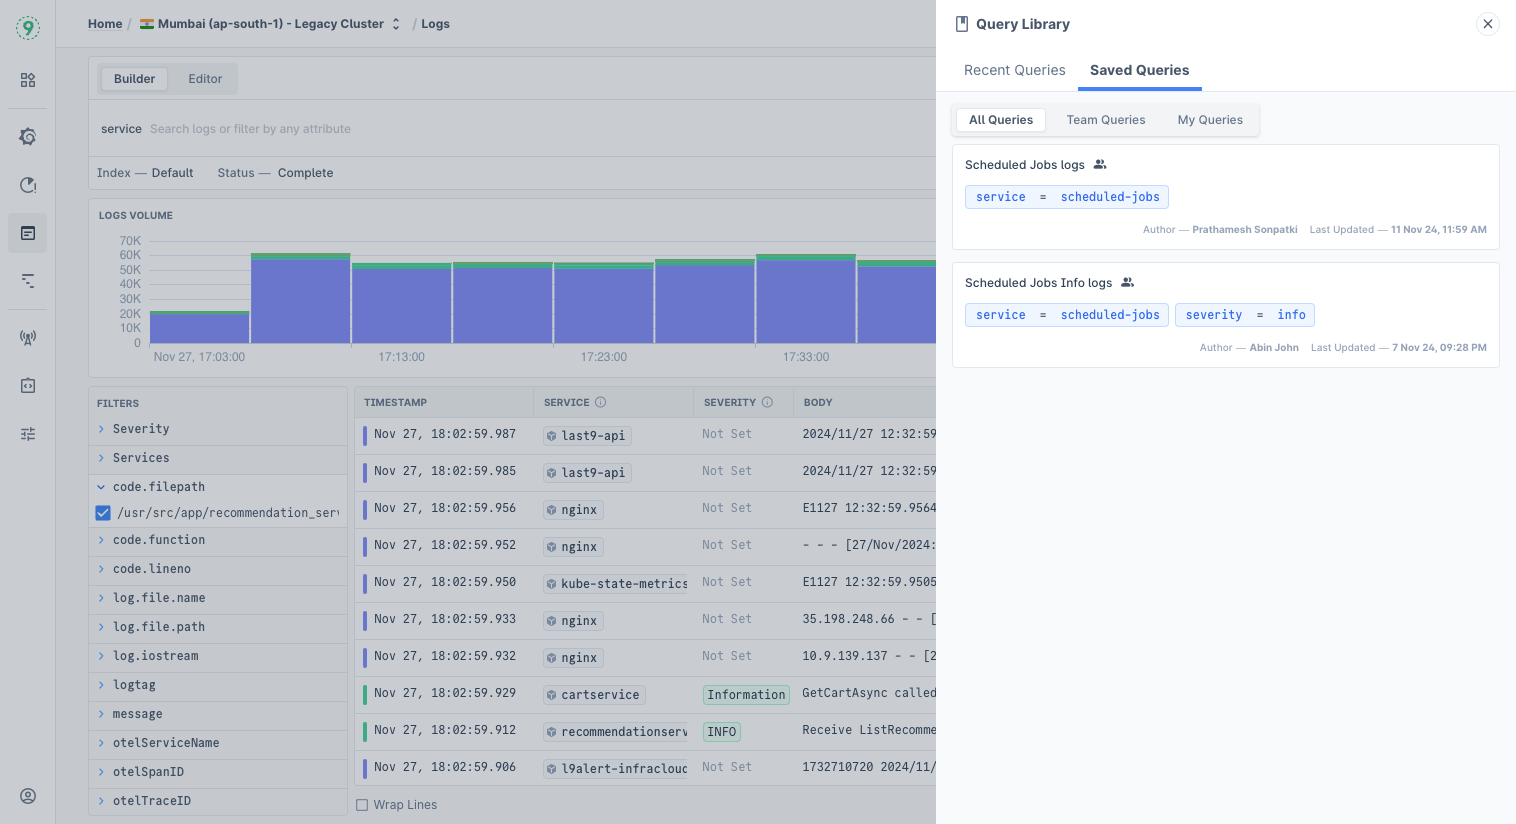
- Recent Queries: This is a history of queries made by you.
- Saved Queries: This is a list of queries saved by your team or you. Queries can be shared with the team or be kept private.
Troubleshooting
Please get in touch with us on Discord or Email if you have any questions.