Apache APISIX
Send APISIX metrics and traces to Last9 using Prometheus Remote Write and Opentelemetry
Introduction
This document will showcase how to send metrics and traces from Apache APISIX to Last9.
Pre-requisites
- You have created a Last9 cluster by following the getting started guide
- You have Apache APISIX set up and running.
Setup Metrics
Enable Prometheus Plugin in APISIX
The APISIX Prometheus Plugin exports metrics in Prometheus exposition format. It can be enabled with following configuration.
plugin_attr:
  prometheus:
    export_uri: /apisix/prometheus/metrics
The exposed metrics can now be fetched as follows:
curl -i http://127.0.0.1:9091/apisix/prometheus/metrics
Follow the official documentation for more details and configuration options for the Prometheus Plugin here.
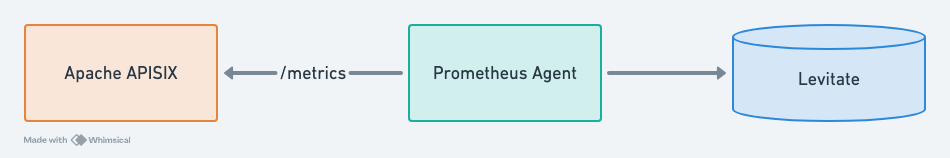
Setup Prometheus Agent
Follow this guide to setup Prometheus agent which will remote write metrics to Last9.
Configure Prometheus Agent to fetch metrics from APISIX
Modify the prometheus.yaml as follows.
scrape_configs:
  - job_name: "apisix"
    scrape_interval: 15s # This value will be related to the time range of the rate function in Prometheus QL. The time range in the rate function should be at least twice this value.
    metrics_path: "/apisix/prometheus/metrics"
    static_configs:
      - targets: ["127.0.0.1:9091"]
The IP Address in the documentation is 127.0.0.1, which may not be
the same in your case. This IP address should ideally be the internal IP address
of the instance in which APISIX is running.
Grafana Dashboard
You can import the Grafana dashboard for APISIX from the repo here
Available Metrics
The following metrics are exported by the APISIX:
- Status code: HTTP status code returned from Upstream services. They are available for a single service and across all services.
- Bandwidth: Total amount of traffic (ingress and egress) flowing through APISIX. Total bandwidth of a service can also be obtained.
etcd reachability: A gauge type representing whether etcd can be reached by APISIX. A value of 1 represents reachable, and 0 represents unreachable.- Connections: Nginx connection metrics like active, reading, writing, and number of accepted connections.
- Batch process entries: A gauge type useful when Plugins like syslog, http-logger, tcp-logger, udp-logger, and zipkin use batch process to send data. Entries that hasn't been sent in batch process will be counted in the metrics.
- Latency: Histogram of the request time per service in different dimensions.
- Info: Information about the APISIX node.
- Shared dict: The capacity and free space of all
nginx.shared.DICTin APISIX. apisix_upstream_status: Health check result status of upstream nodes. A value of 1 represents healthy and 0 represents unhealthy.
Detailed information on the exposed metrics and their dimensions can be found here
Setup Traces
The APISIX OpenTelemetry plugin can be used to report tracing data according to the OpenTelemetry specification.

Enable Opentelemetry Plugin in APISIX
Enable the Opentelemetry plugin as follows:
plugins:
  - opentelemetry
plugin_attr:
  opentelemetry:
    resource:
      service.name: APISIX
      tenant.id: business_id
    collector:
      address: <leviate_otlp_endpoint>
      request_timeout: 3
      request_headers:
        foo: bar
    batch_span_processor:
      drop_on_queue_full: false
      max_queue_size: 6
      batch_timeout: 2
      inactive_timeout: 1
      max_export_batch_size: 2
You can follow the official documentation on enabling the Opentelemetry plugin here.
This will send traces from APISIX to Last9 with Opentelemetry Specification.
Troubleshooting
Please get in touch with us on Discord or Email if you have any questions.