What is Last9?
Everything you need to know about Last9’s single pane for high cardinality observability, the underlying telemetry data platform powering Last9, and the control plane built on top of it.
What is Last9?
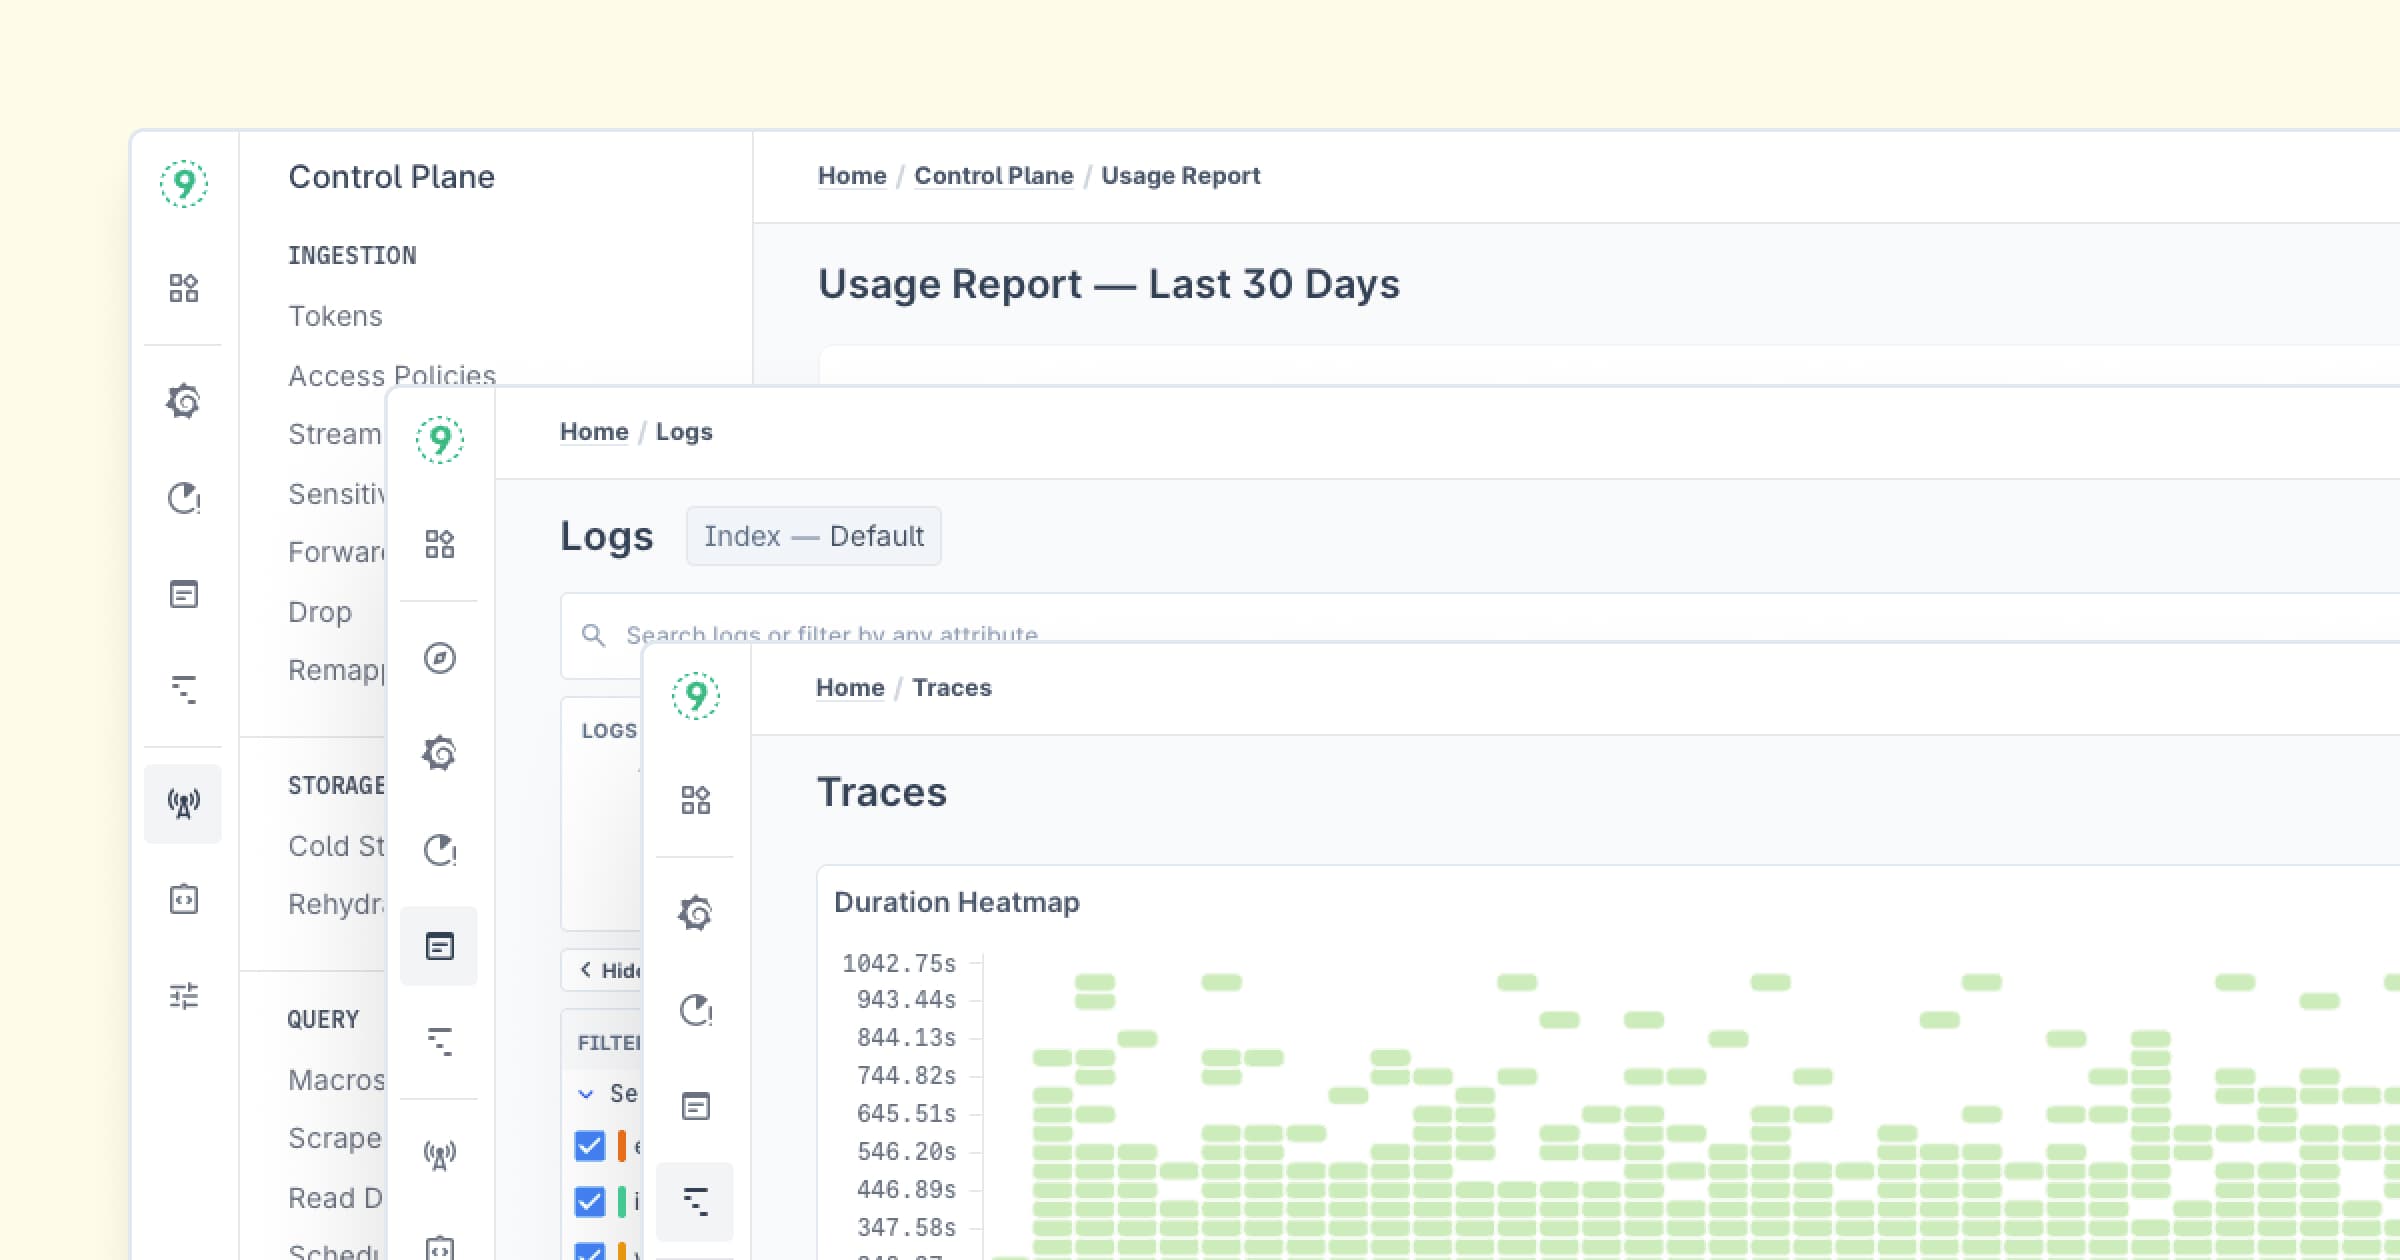
Last9 is a high cardinality observability tool for all your telemetry types — logs, traces, and metrics in a single pane, with first-class telemetry lifecycle management and anomaly-detection-based alerting capabilities.

- Open Standards: Built for Cloud Native environment, Last9 is OpenTelemetry-native and Prometheus compatible, and also integrates with over 100 sources to collect data across all telemetry types.
- Single Pane: Correlate and alert on your application & infrastructure metrics, events, logs, and traces in one place. Debug faster and get to the root cause without changing the context.
- Simple Pricing: Our architectural choices and the decision to build on Open Standards allow us to pass on those savings to you. Predictable “pay for what you use” plan. No per-host billing. No per-user billing. No separate custom metrics billing.
Telemetry Data Platform, not just a database
Modern micro-service architectures demand granular observability, which traditional/legacy observability products find difficult to provide support for. Self-driving cars are only possible because of today’s high-definition cameras and other high-fidelity inputs. Similarly, that’s what engineering teams today and in the future need.
Since 2020, Last9 has been focused on solving for high-cardinality metrics. Twelve of the 18 largest live-streaming events in the world have used Last9 for their observability — the peak being 59 million concurrent viewers on Diney+ Hotstar for the 2023 Cricket World Cup.
From a highly performant and scalable time series warehouse, Last9 has now evolved into a telemetry data platform to add support for logs and traces as well — all powered by a first-class Control Plane to manage your telemetry, its settings, and lifecycle.
Last9 has decoupled the UI from the telemetry data platform unlocking various use cases and experiences:
- Last9’s native explorer UIs for correlated telemetry and first-class search and filtering experience along with LogQL and TraceQL support.
- Teams used to and more comfortable with Grafana can use the embedded instance for metrics dashboarding or the Loki and Tempo plugins for logs and traces.
- Access telemetry directly via APIs to power your third-party monitoring tools or to build custom visualizations in your products for your customers.
Instrumentation
Last9 is OpenTelemetry-native and fully Prometheus compatible. The telemetry data platform can ingest logs, traces, and metrics at scale from over 100 sources — from infrastructure like AWS and Cloudflare to applications built on JavaScript, Python, Ruby, and more. See our documented list of integrations here.
Control Plane
A first-class developer experience to manage your telemetry, its settings, and lifecycle across Ingestion, Storage, Query, and Usage. Read more about the Control Plane.
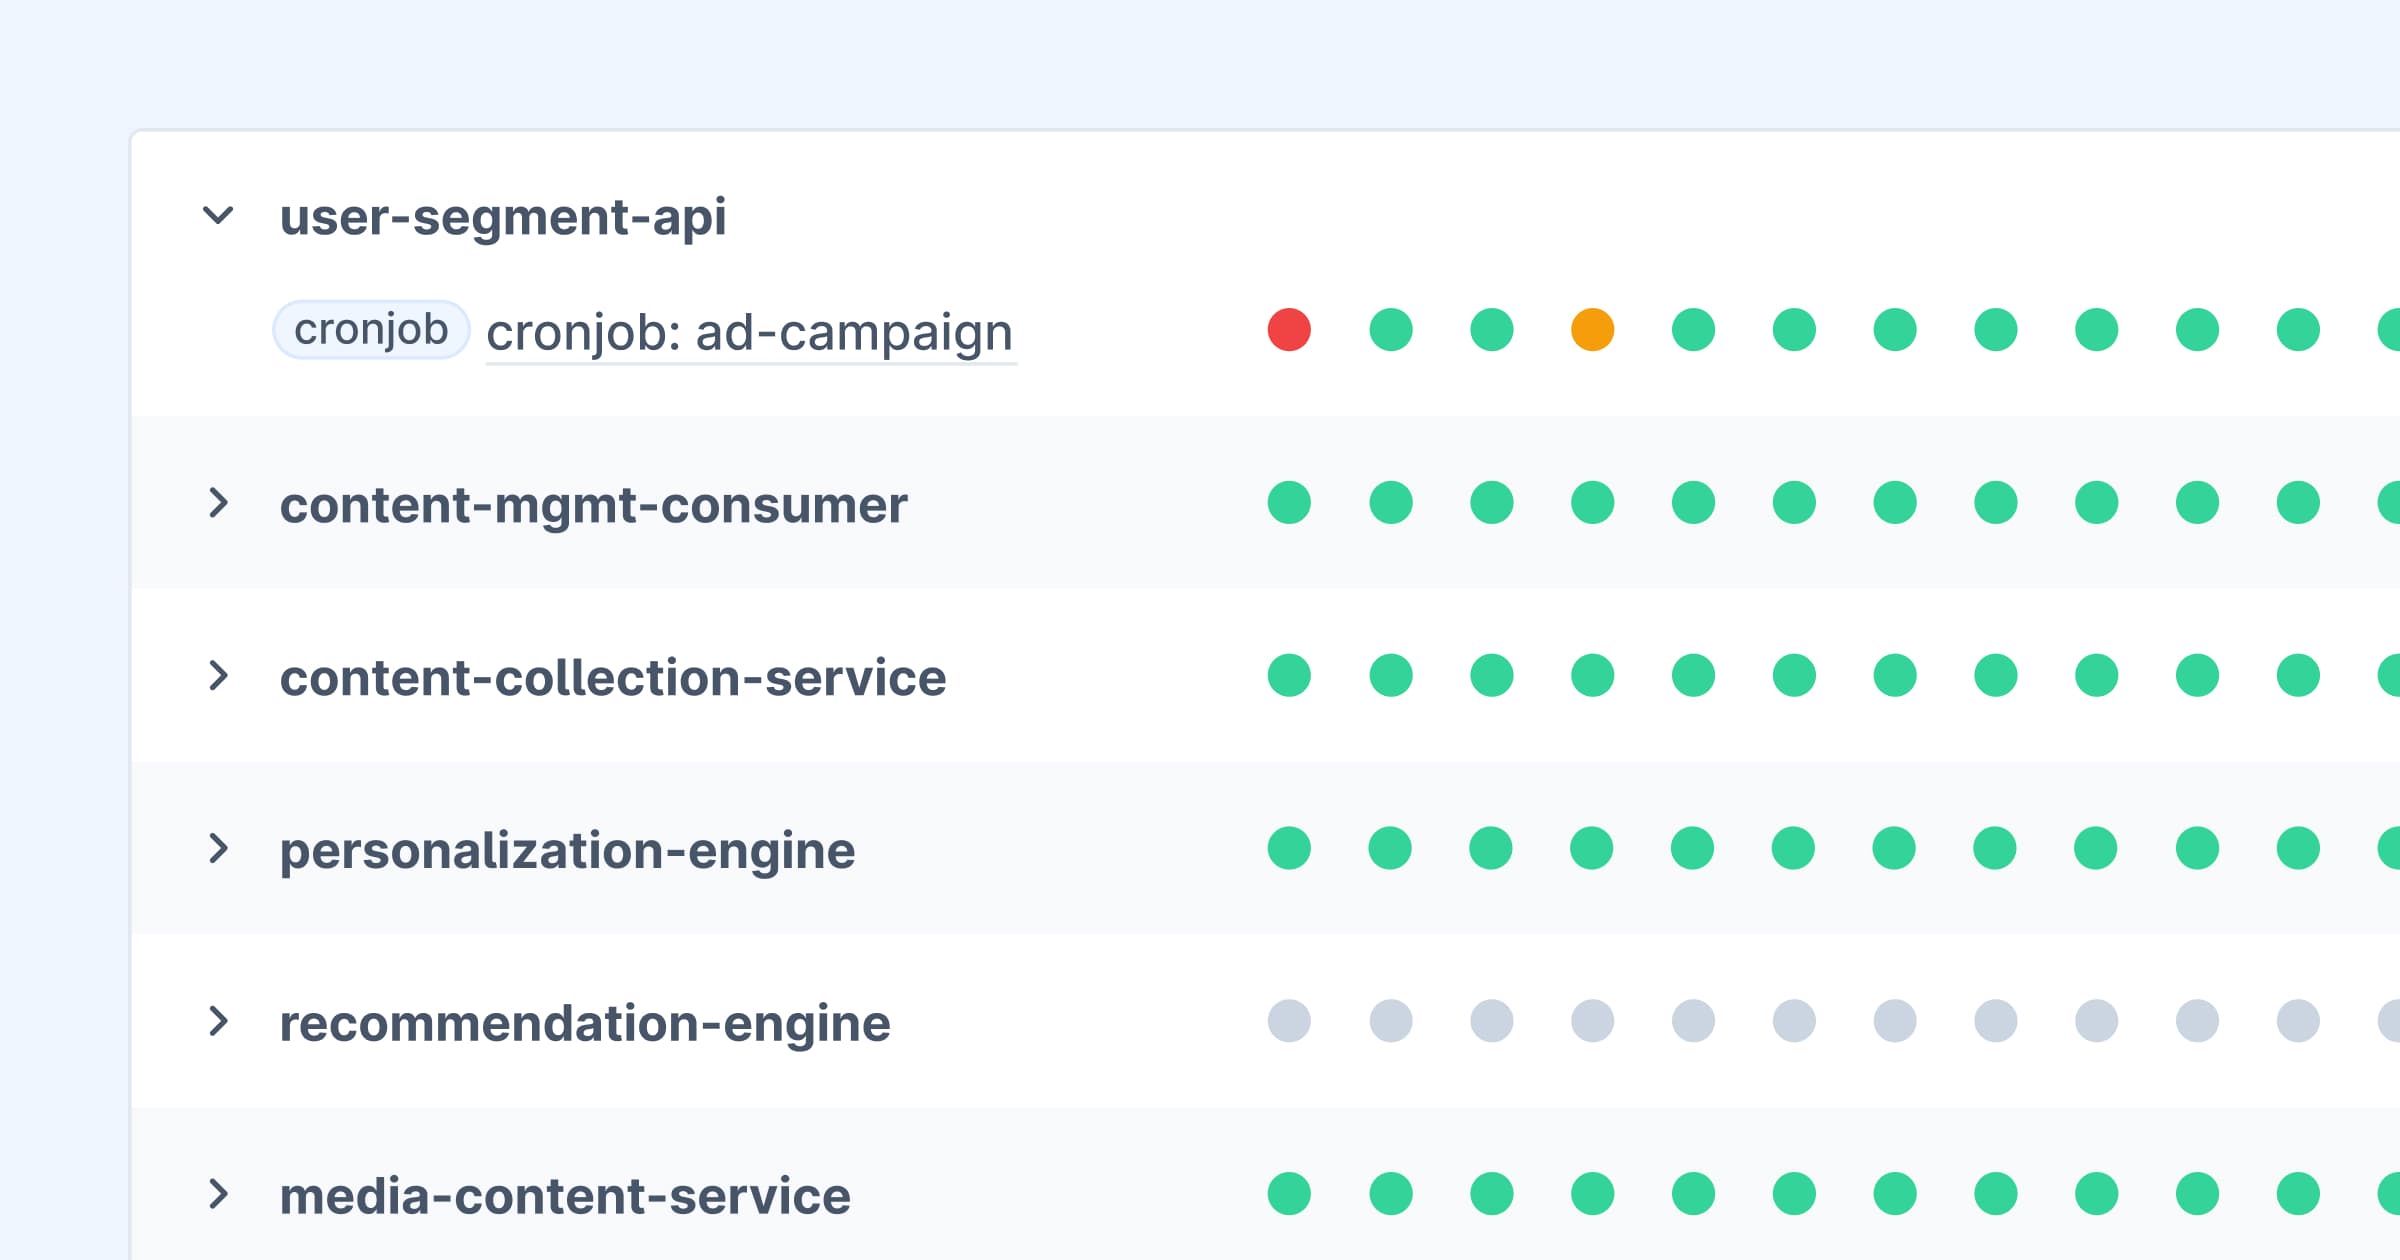
- Ingestion: Pre-ingestion workflows allow you to manage incoming telemetry during runtime without having to make instrumentation changes or redeploy your application — configure rules for streaming aggregations, filtering, and routing.
- Storage: Configure cold storage settings and rehydration indexes.
- Query: Define macros for reusing complex queries, and configure notifications for scheduled search patterns.
- Usage: Understand usage and metrics cardinality, and view slow query logs.
Purpose-built for High Cardinality

Here’s what one of our customers said when we asked why they’re picking us over others:
You’ve cracked high cardinality at scale for metrics. We can trust you with logs and traces at scale as well.
Solving for high cardinality metrics has enabled our customers to gain granular observability. But also allows us to provide Logs-to-Metrics and Traces-to-Metrics pipelines to power historical reporting and anomaly detection. Read our guide to the anatomy of Log Data to understand how high cardinality applies to logs and traces as well.
- High-fidelity observability: Instrument your system for individual users, tenants, sessions, etc. without worrying about cardinality explosion. Unlock granular monitoring and alerting for use cases like tenant-level debugging, and use Changeboards for correlated health.
- Cardinality workflows and superior defaults: Along with a starting quota of 20M time series per metric, tools like Cardinality Explorer enable you to understand impacted metrics and use Streaming Aggregation to control it without instrumentation changes.
Operational & Change Intelligence

Coming SoonOperational Recommendations: Understanding incoming telemetry and its historical patterns to suggest dashboards, alerting, additional instrumentation, and deviations in telemetry.- One-click Dashboards and Alerting: Quickstart your observability and improve coverage of your system with recommendations from our library of standard components for APM and infrastructure monitoring.
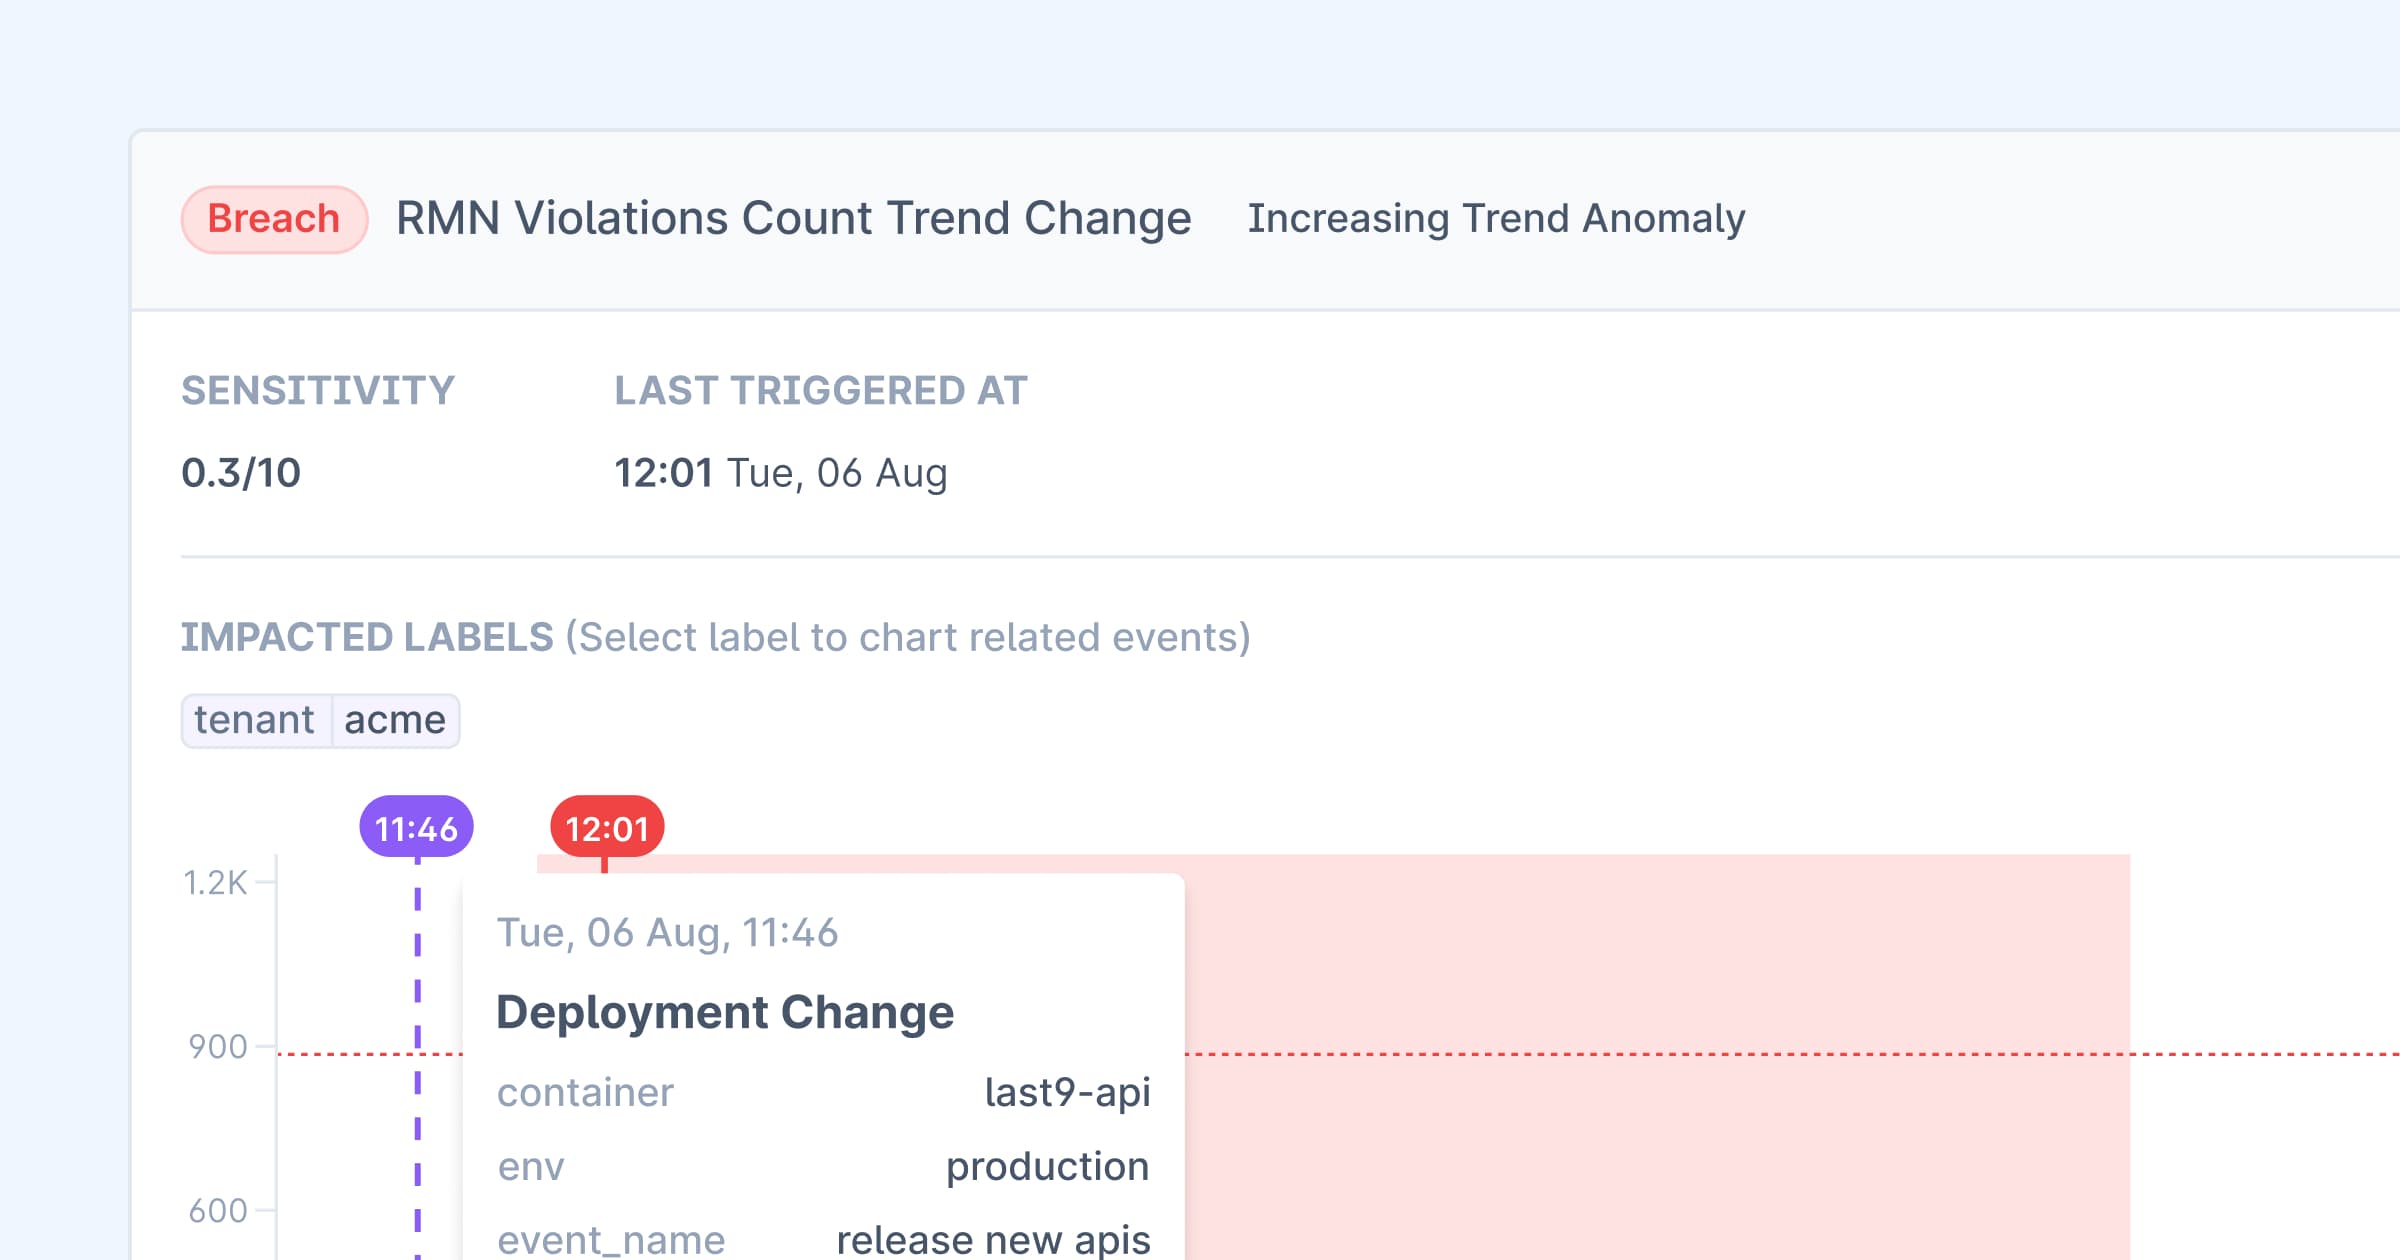
- Anomaly Detection and Change Events: Pattern matching algorithms in Alert Studio that go beyond static thresholds to reduce alert fatigue. Track deployments and feature flags using Change Events.
Industry Standards
- Deploy in your cloud: Last9 is available as SaaS or BYOC/on-prem deployments. Take advantage of AWS and GCP marketplaces to ease procurement, avail cloud credits, and forget about egress costs.
- Managed to take the toil away: We regularly handle 400M samples/min and 35M concurrent users (59M at peak) for one of our biggest customers.
- Compliance ready: Last9 is SOC2 Type II approved and PCI ready, with access controls, multi-region support, and OAuth-based SSO.
- SLAs with clawback: We commit to the 99.9% write and 99.5% read availability to our SaaS customers, with higher SLAs for enterprise customers.
Get Started
Follow our Quick Start Guide to get set up and start sending data. Please get in touch with us on Discord or by Email if you have any questions. You can schedule a demo with us.