Traces Explorer
Use Last9's native UI for tarces with first-class search and filters — quickly view dependencies with a waterfall timeline, span attributes and events, and related logs by clicking on any trace span.
Using Traces Explorer
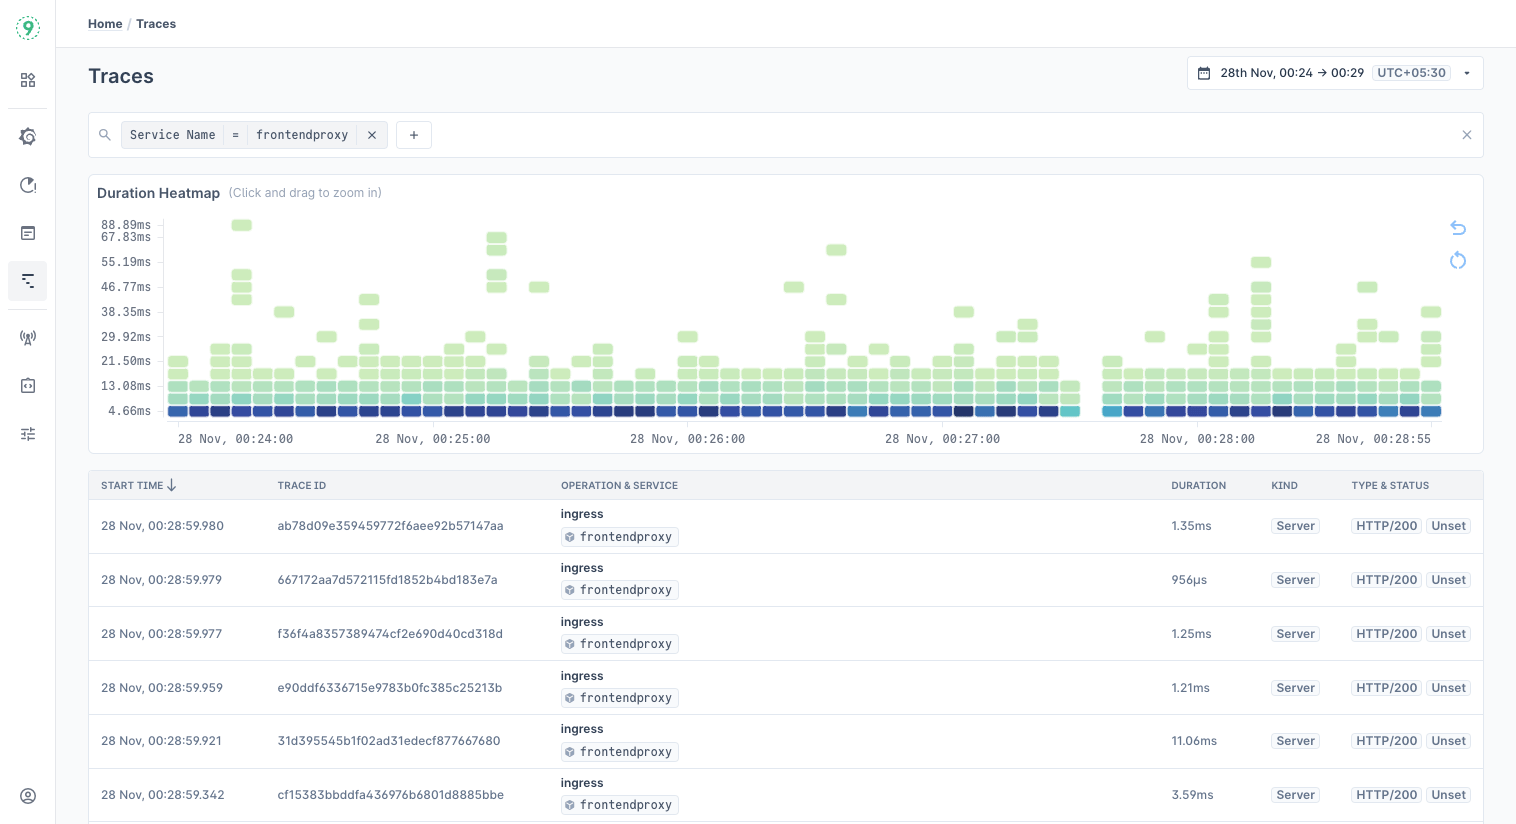
You can start exploring traces by visiting Traces Explorer in Last9. The Traces Explorer allows to filter traces by specific traces attributes and resource info to slice and dice by various trace dimensions, and view correlated telemetry.

Last9 provides a native experience to explore your traces without using any query language.
- Search:
- With auto-complete support,
serviceandspanare first-class attributes - Supported operators are
equal,not equal,exists, anddoes not exist
- With auto-complete support,
- Time Picker: Select an absolute or relative time range. You can also switch between timezones.
- Duration Heatmap: A heatmap of latency distribution. Click and drag to zoom into and filter out specific outliers.
Trace Details

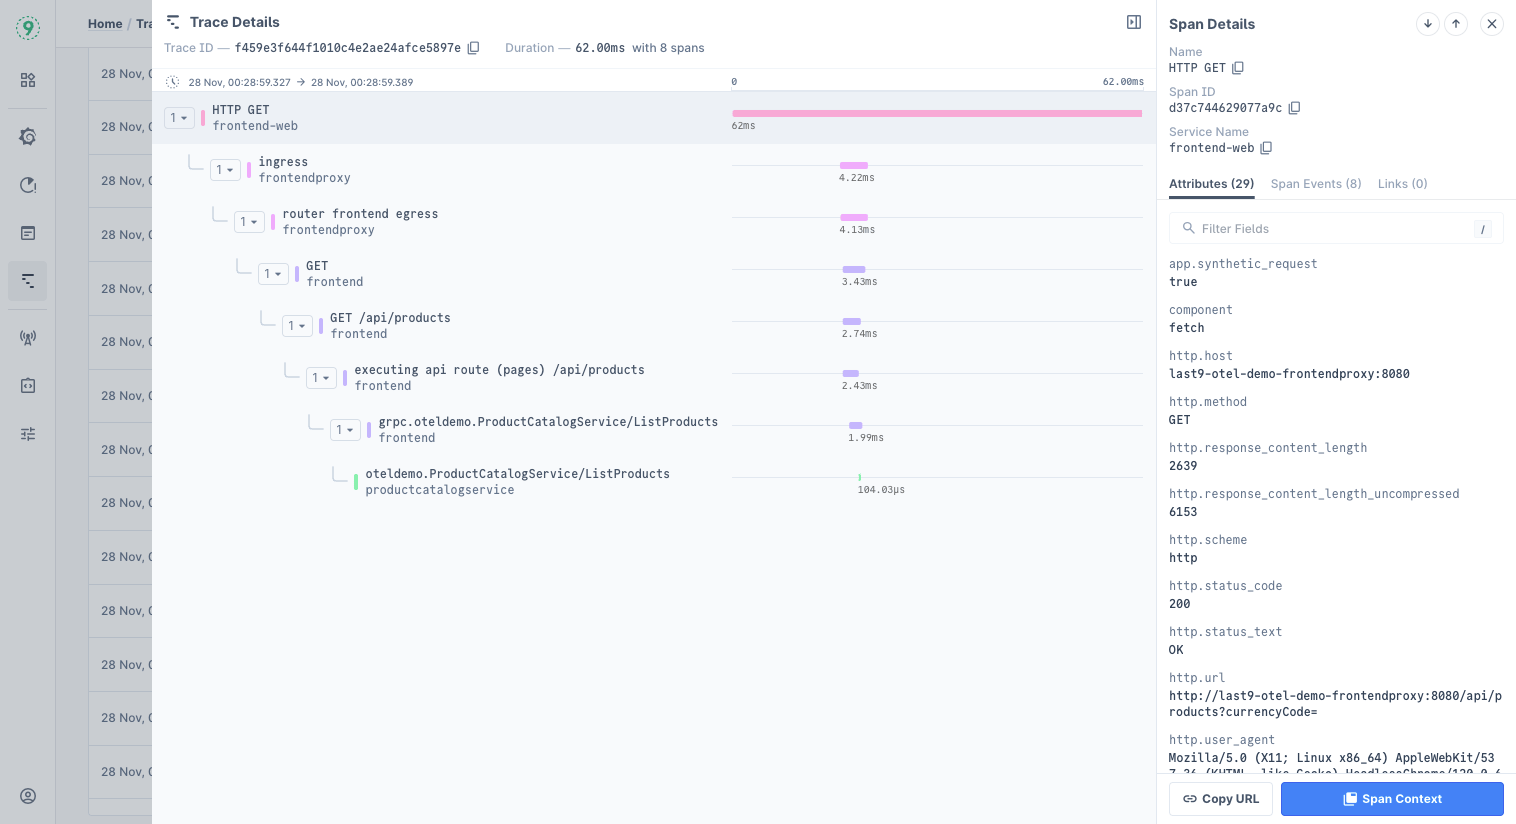
Clicking on a trace in Traces Explorer opens a side panel with additional context and information about the selected trace ID.
- Duration and no. of spans
- Waterfall timeline with dependencies
- Click on the count pill to view any child spans
- Click on a span to view span details
- Span Details with:
- Span Name
- Span ID
- Service Name
- Attributes
- Span Events
- Links
- Span Context with attributes, resource info, and related logs
Troubleshooting
Please get in touch with us on Discord or Email if you have any questions.