Quick Start Guide
Onboard with Last9, create your first cluster, and start writing metrics data under just two minutes
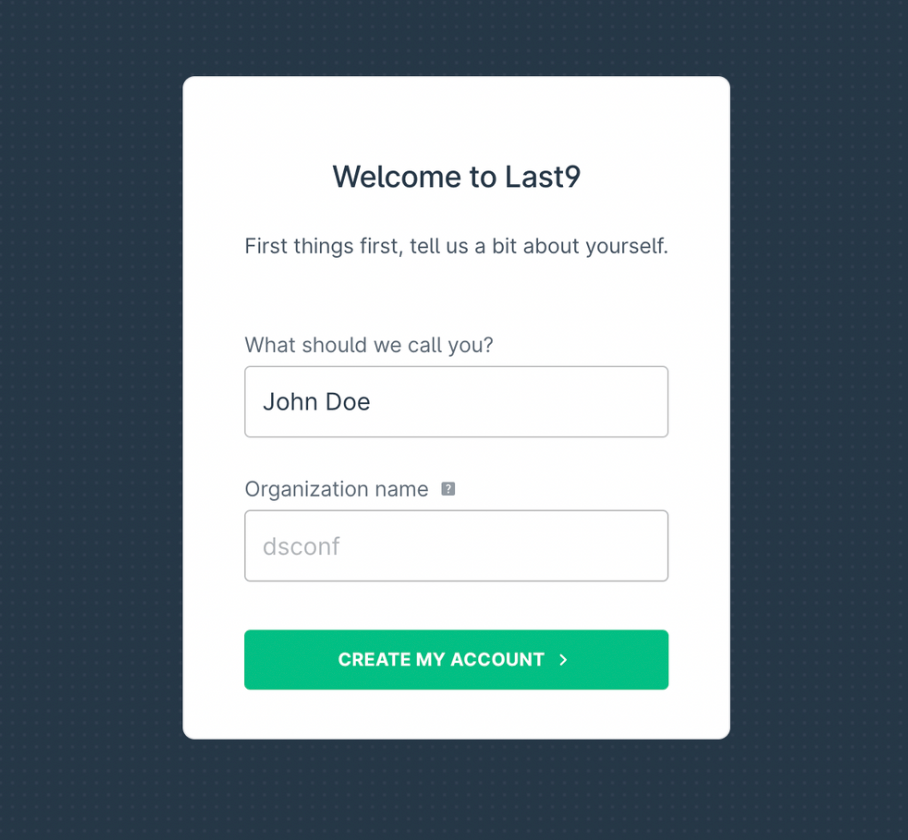
Last9 takes under two minutes to sign up and get started. After signing up, you can create a cluster, grab a remote write URL, and plug it into your existing Prometheus or OpenTelemetry agents, and send metrics to Last9.
Here is a walkthrough to sign up, create your first Last9 cluster, and get a fully functional managed time series database and Grafana in under two minutes.
Sign up on Last9
Sign up via your Google/Microsoft Business account here.
Note that Last9 only allows work/business email accounts to sign up. Using
personal emails is not allowed. You can use GitHub login for personal emails
instead. 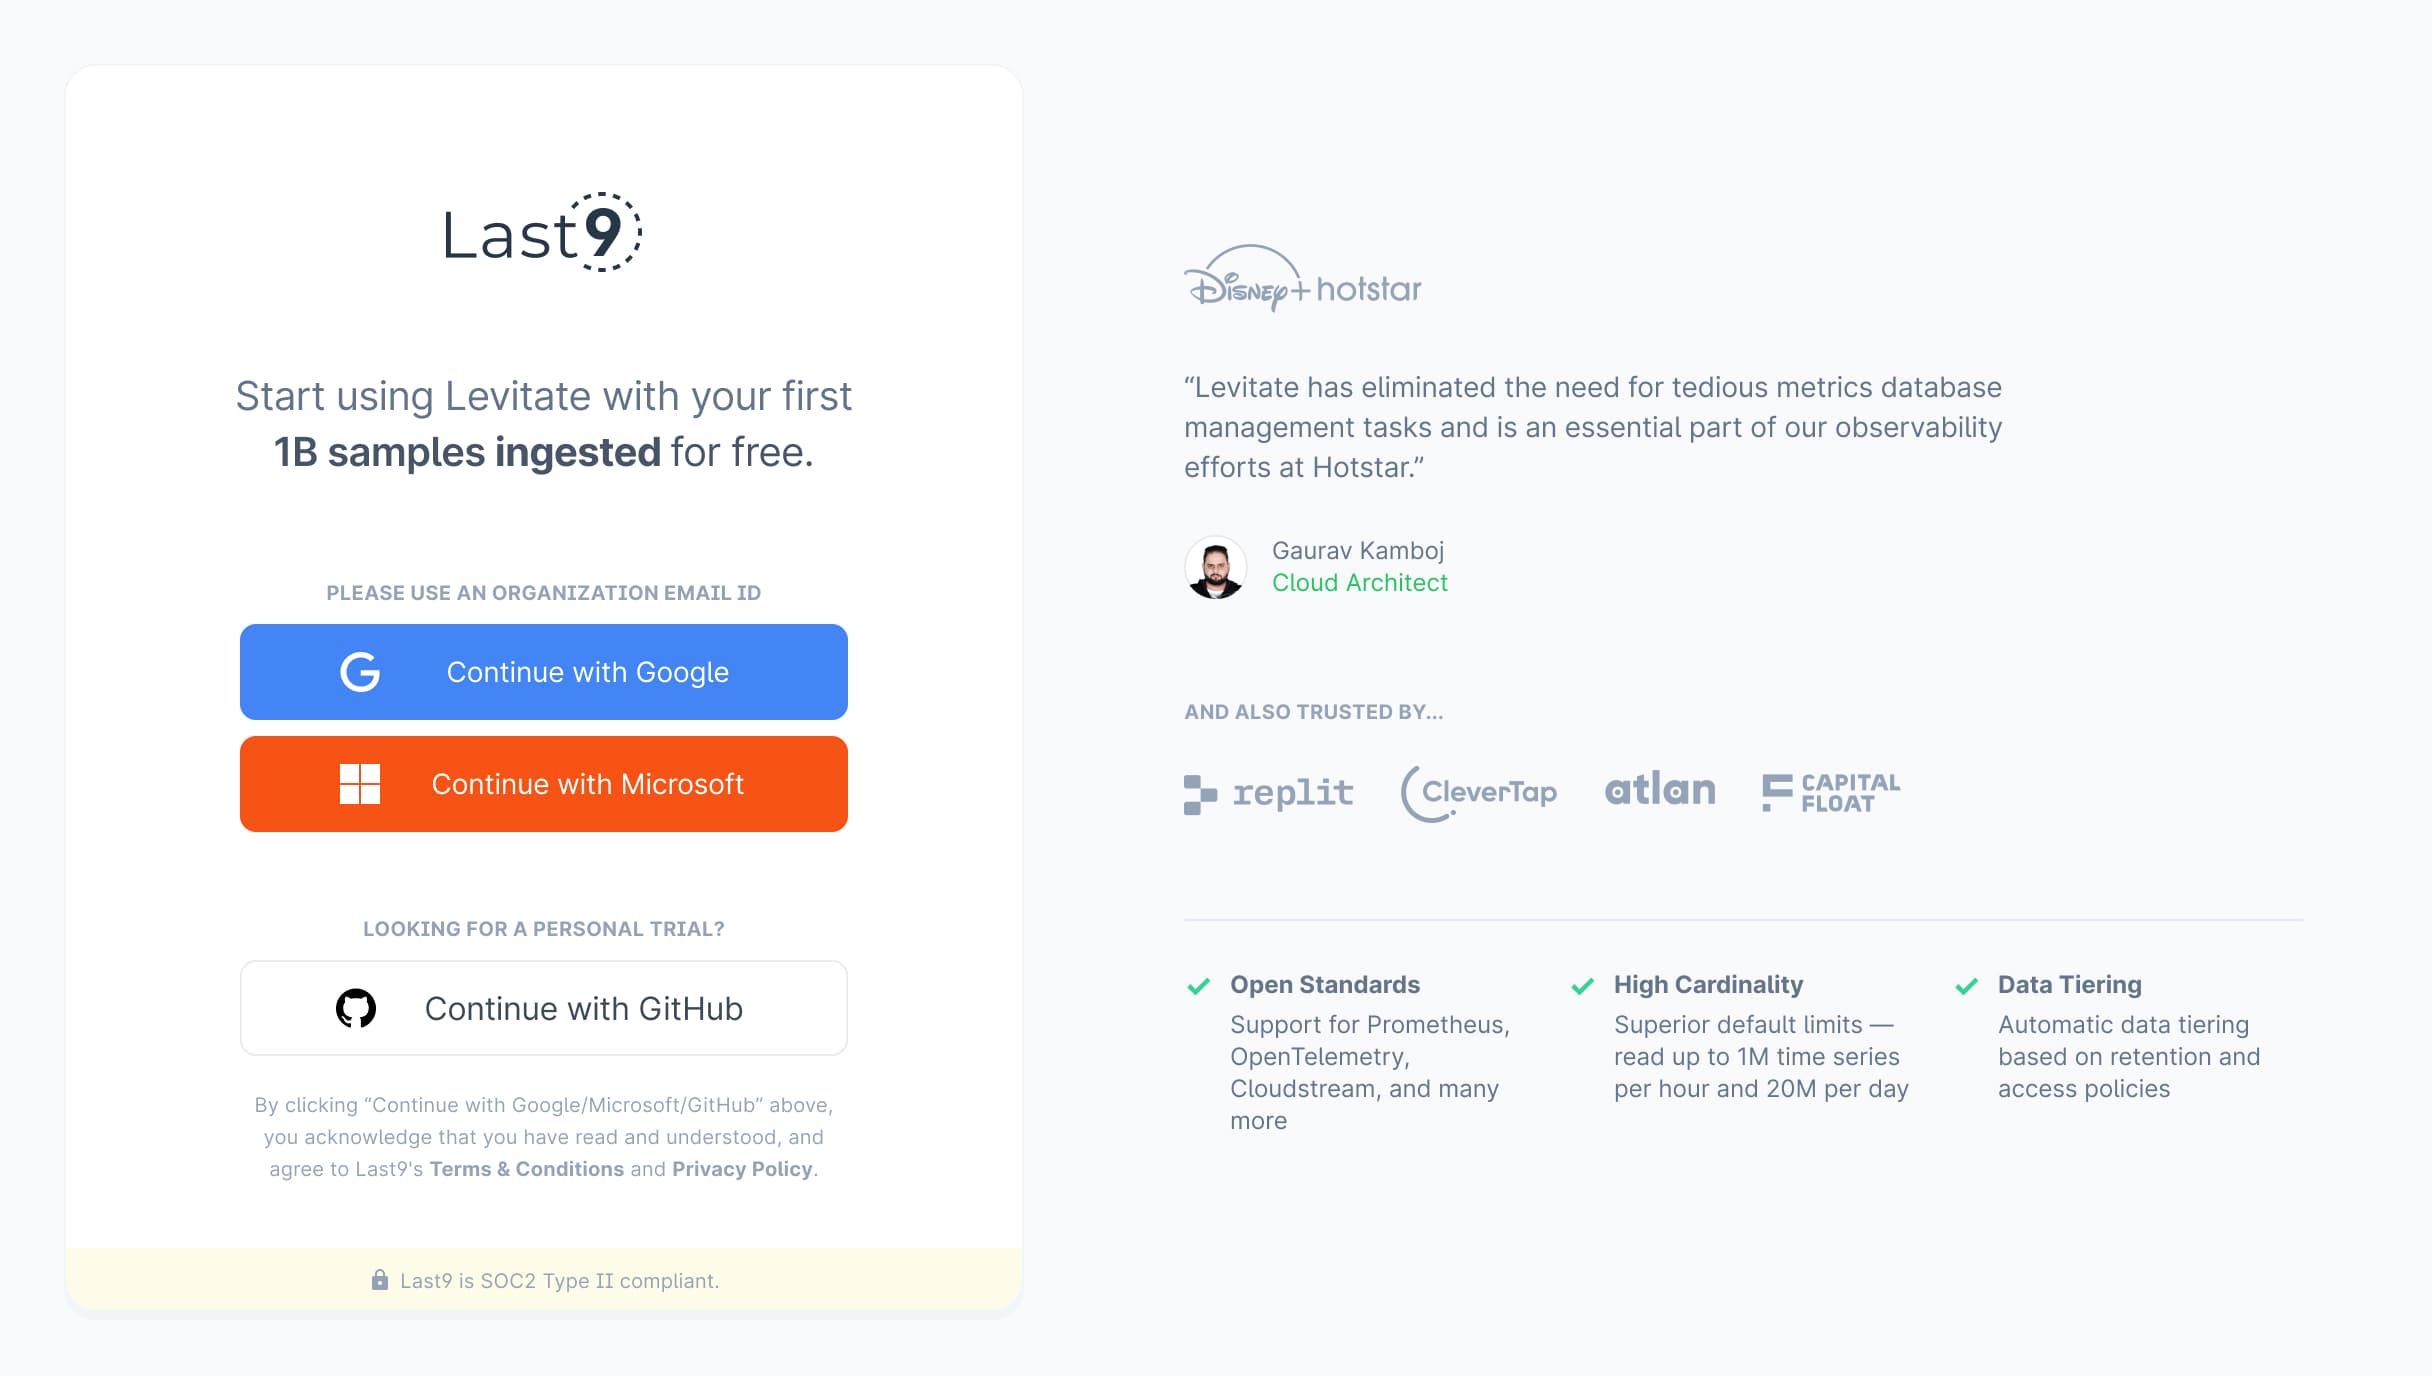
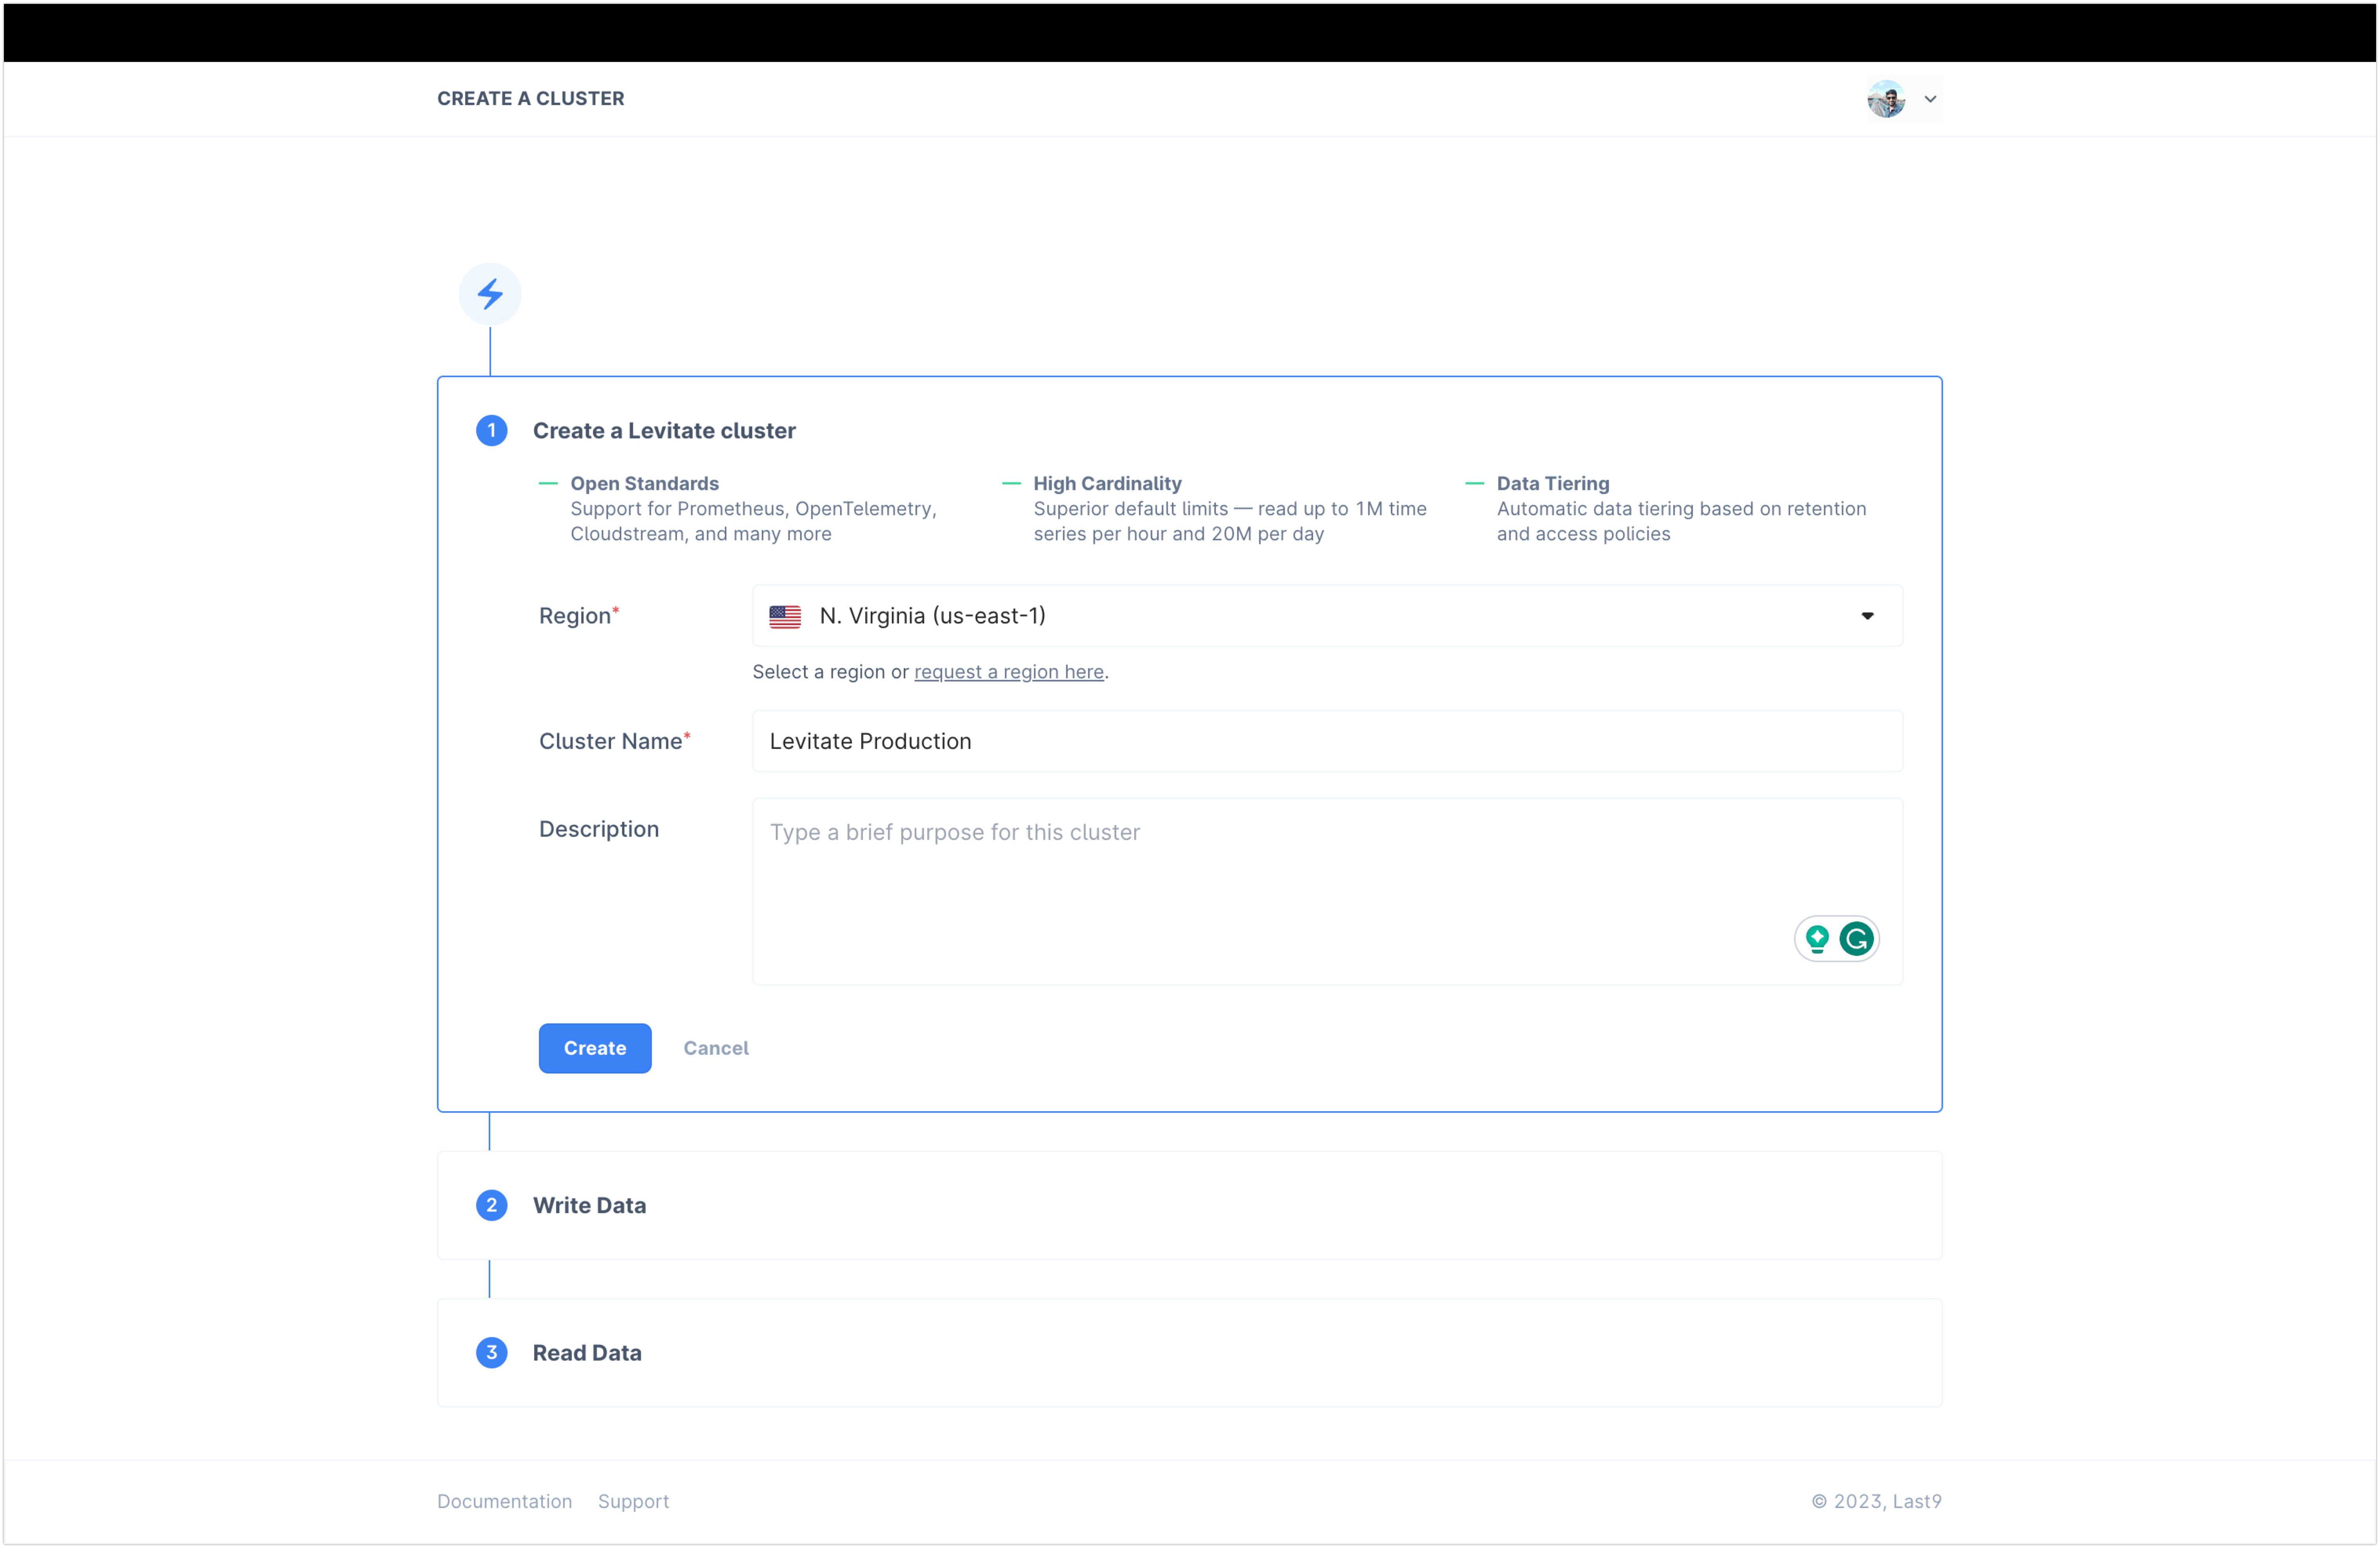
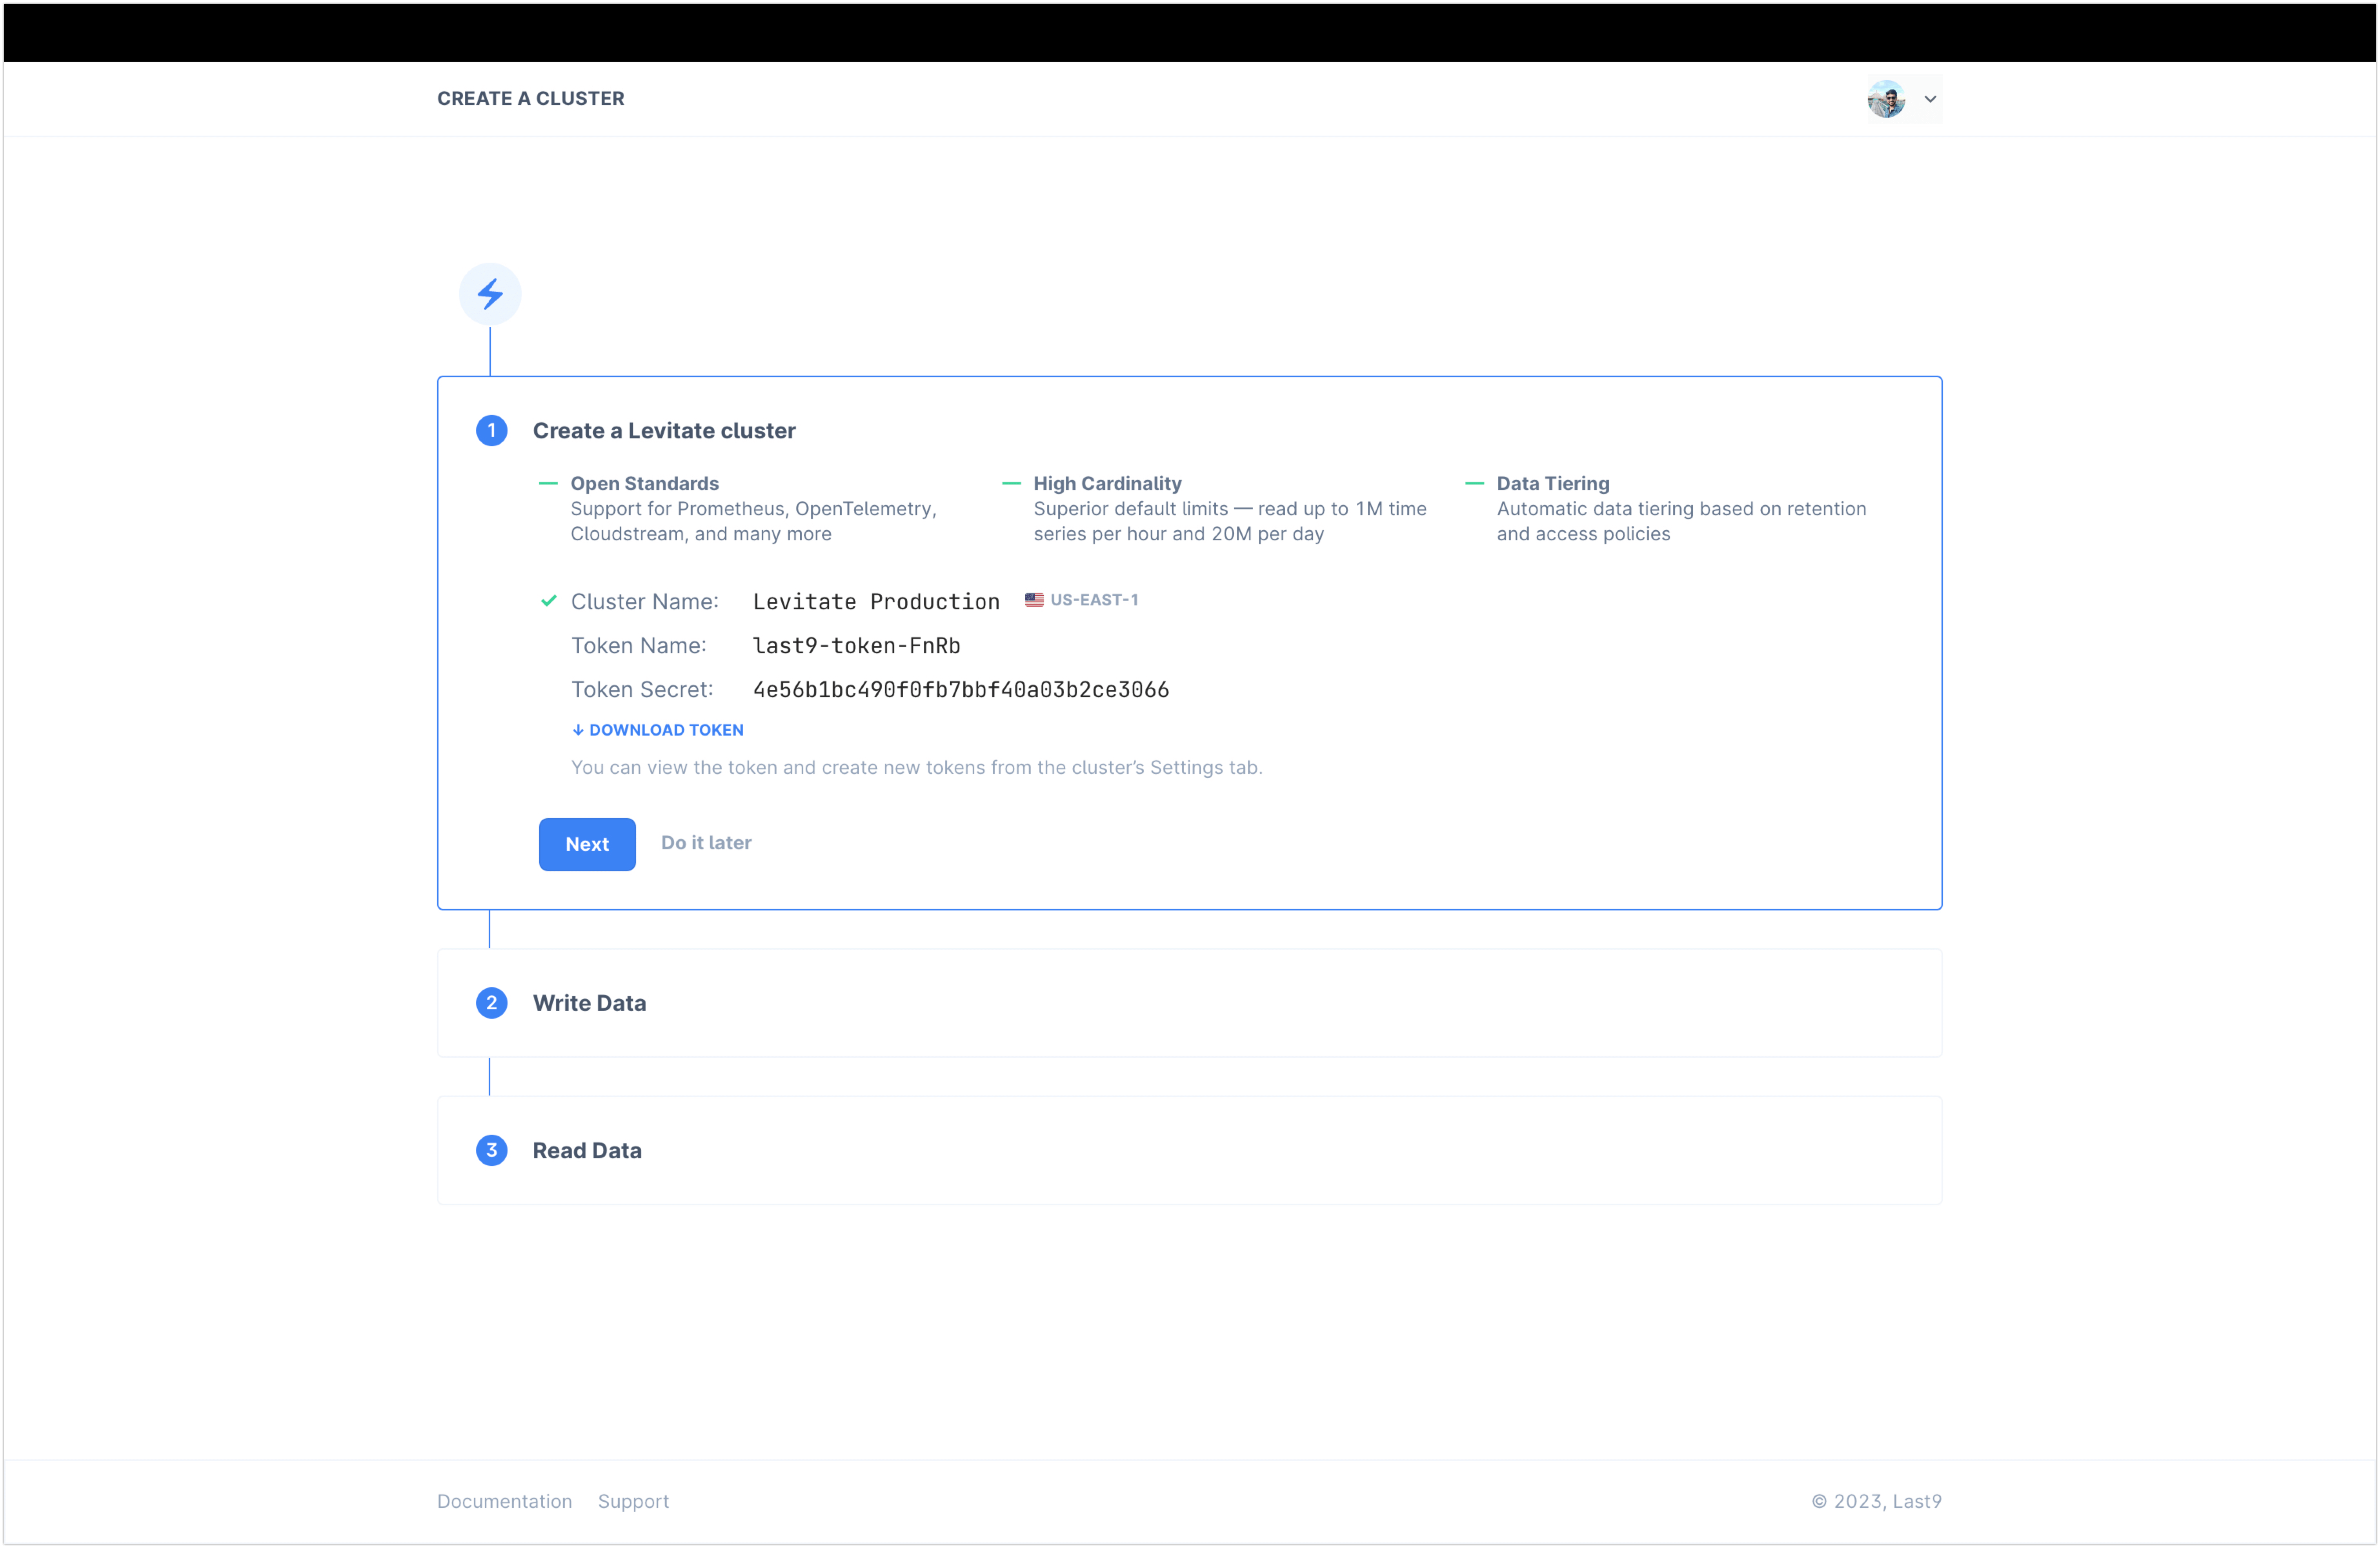
Set up Last9 Cluster
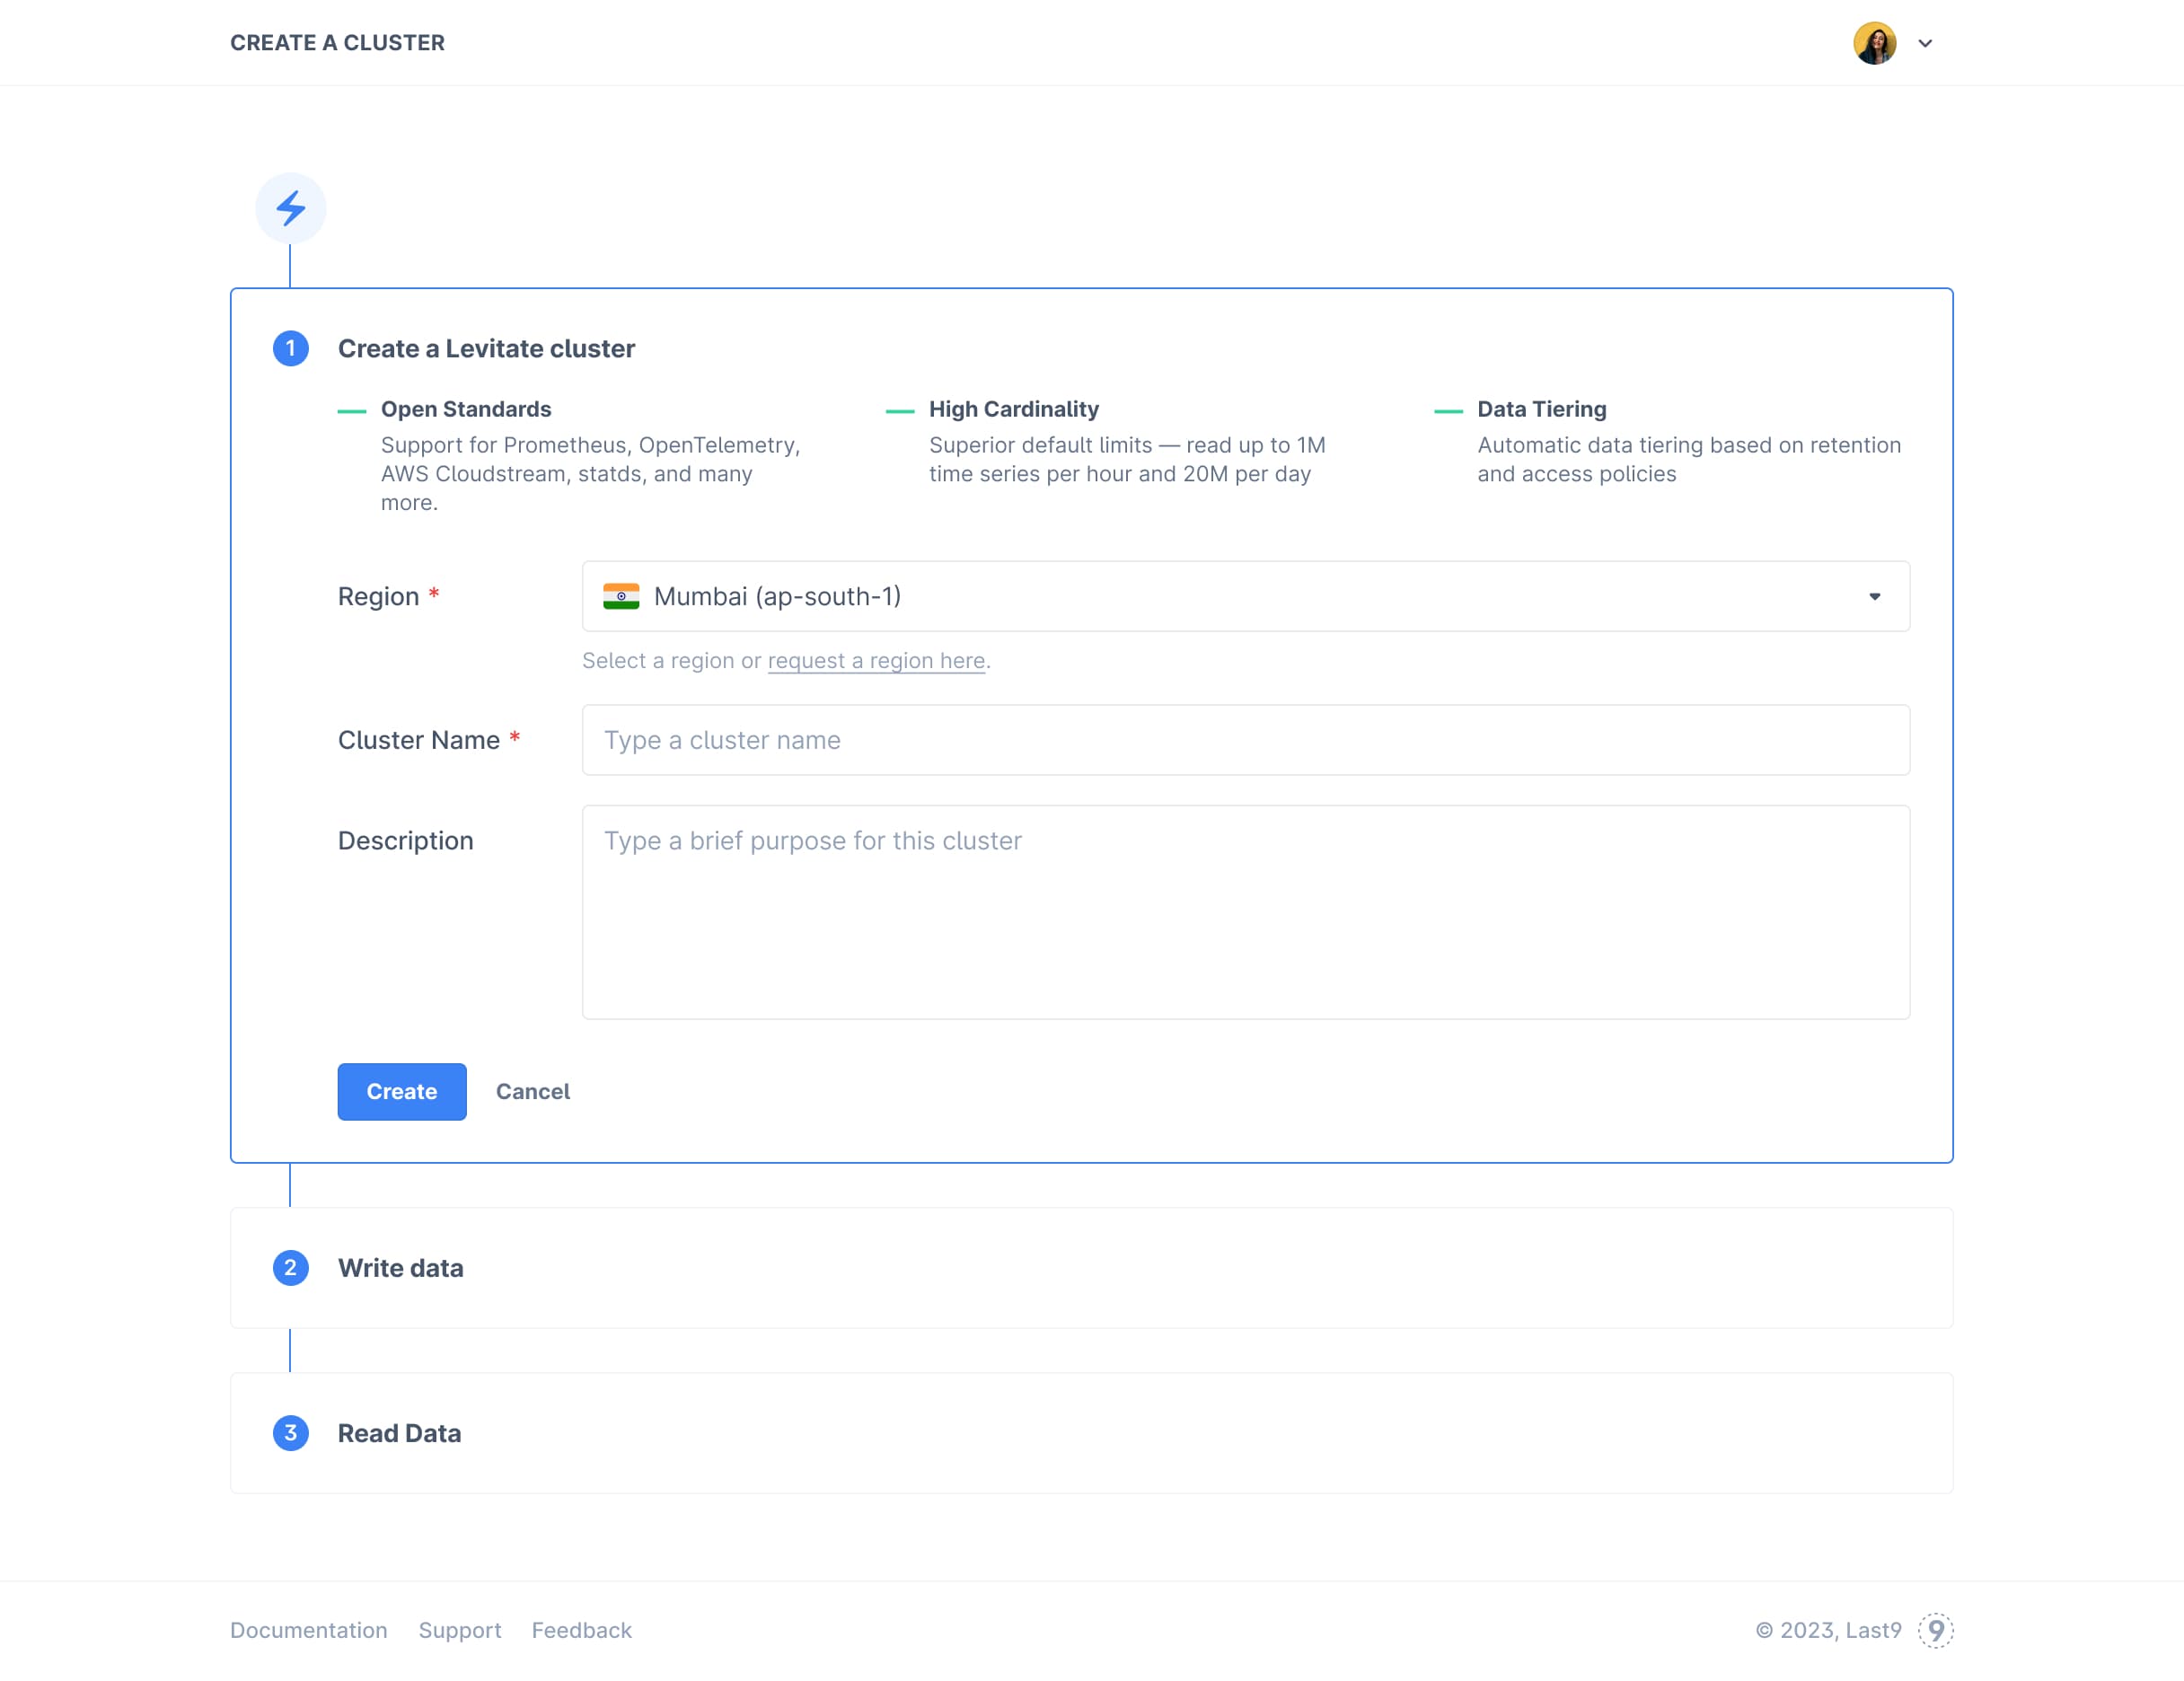
Provide details of the cluster you are creating:
- Region → Asia/Mumbai(ap-south-1) OR Europe/Frankfurt(eu-west-1) OR North America/Virginia(us-east-2)
- Cluster Name → Identify your cluster with a name
- Description → Some additional info on what purpose this cluster serves
Copy the Read and Write Token
Once you hit Create, Last9 automatically creates a token to access the
metrics data. Just copy it and store in a secure place to be used in Prometheus
or OpenTelemetry configurations.
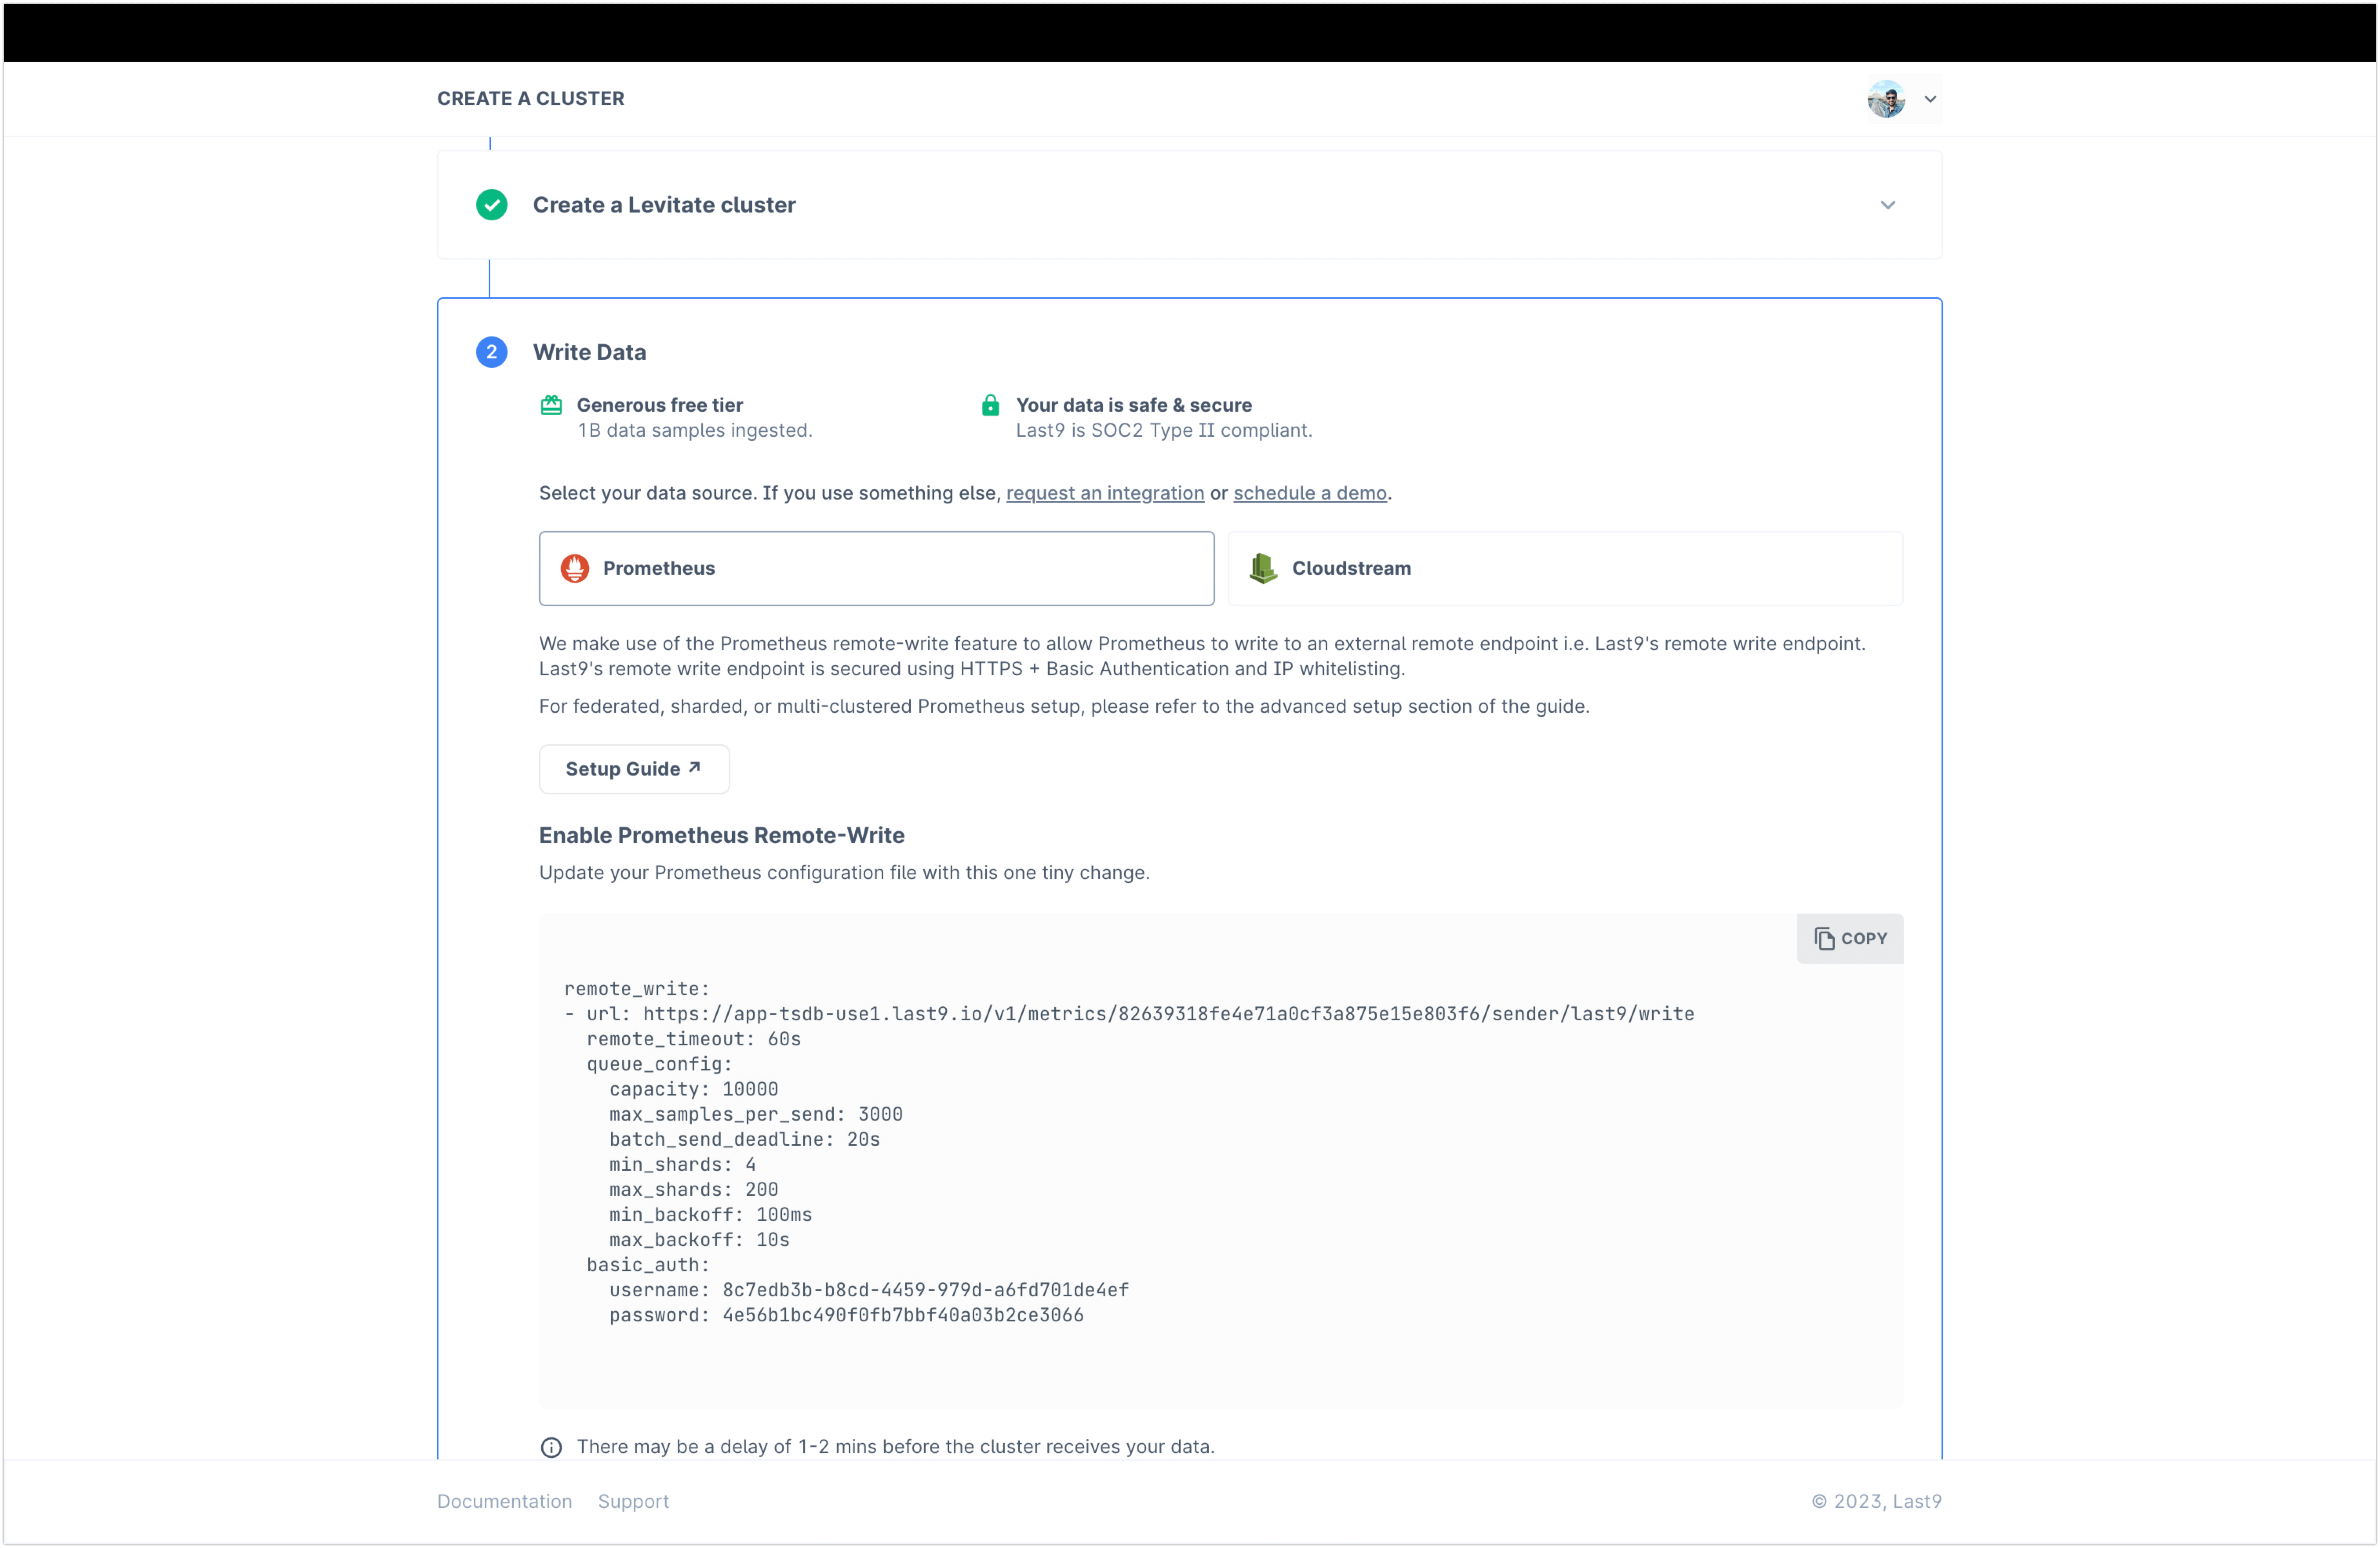
Start writing data to Last9
Copy the Write Configuration and paste it to your Prometheus remote write config. Then, reload Prometheus to start sending data to your Last9 cluster.
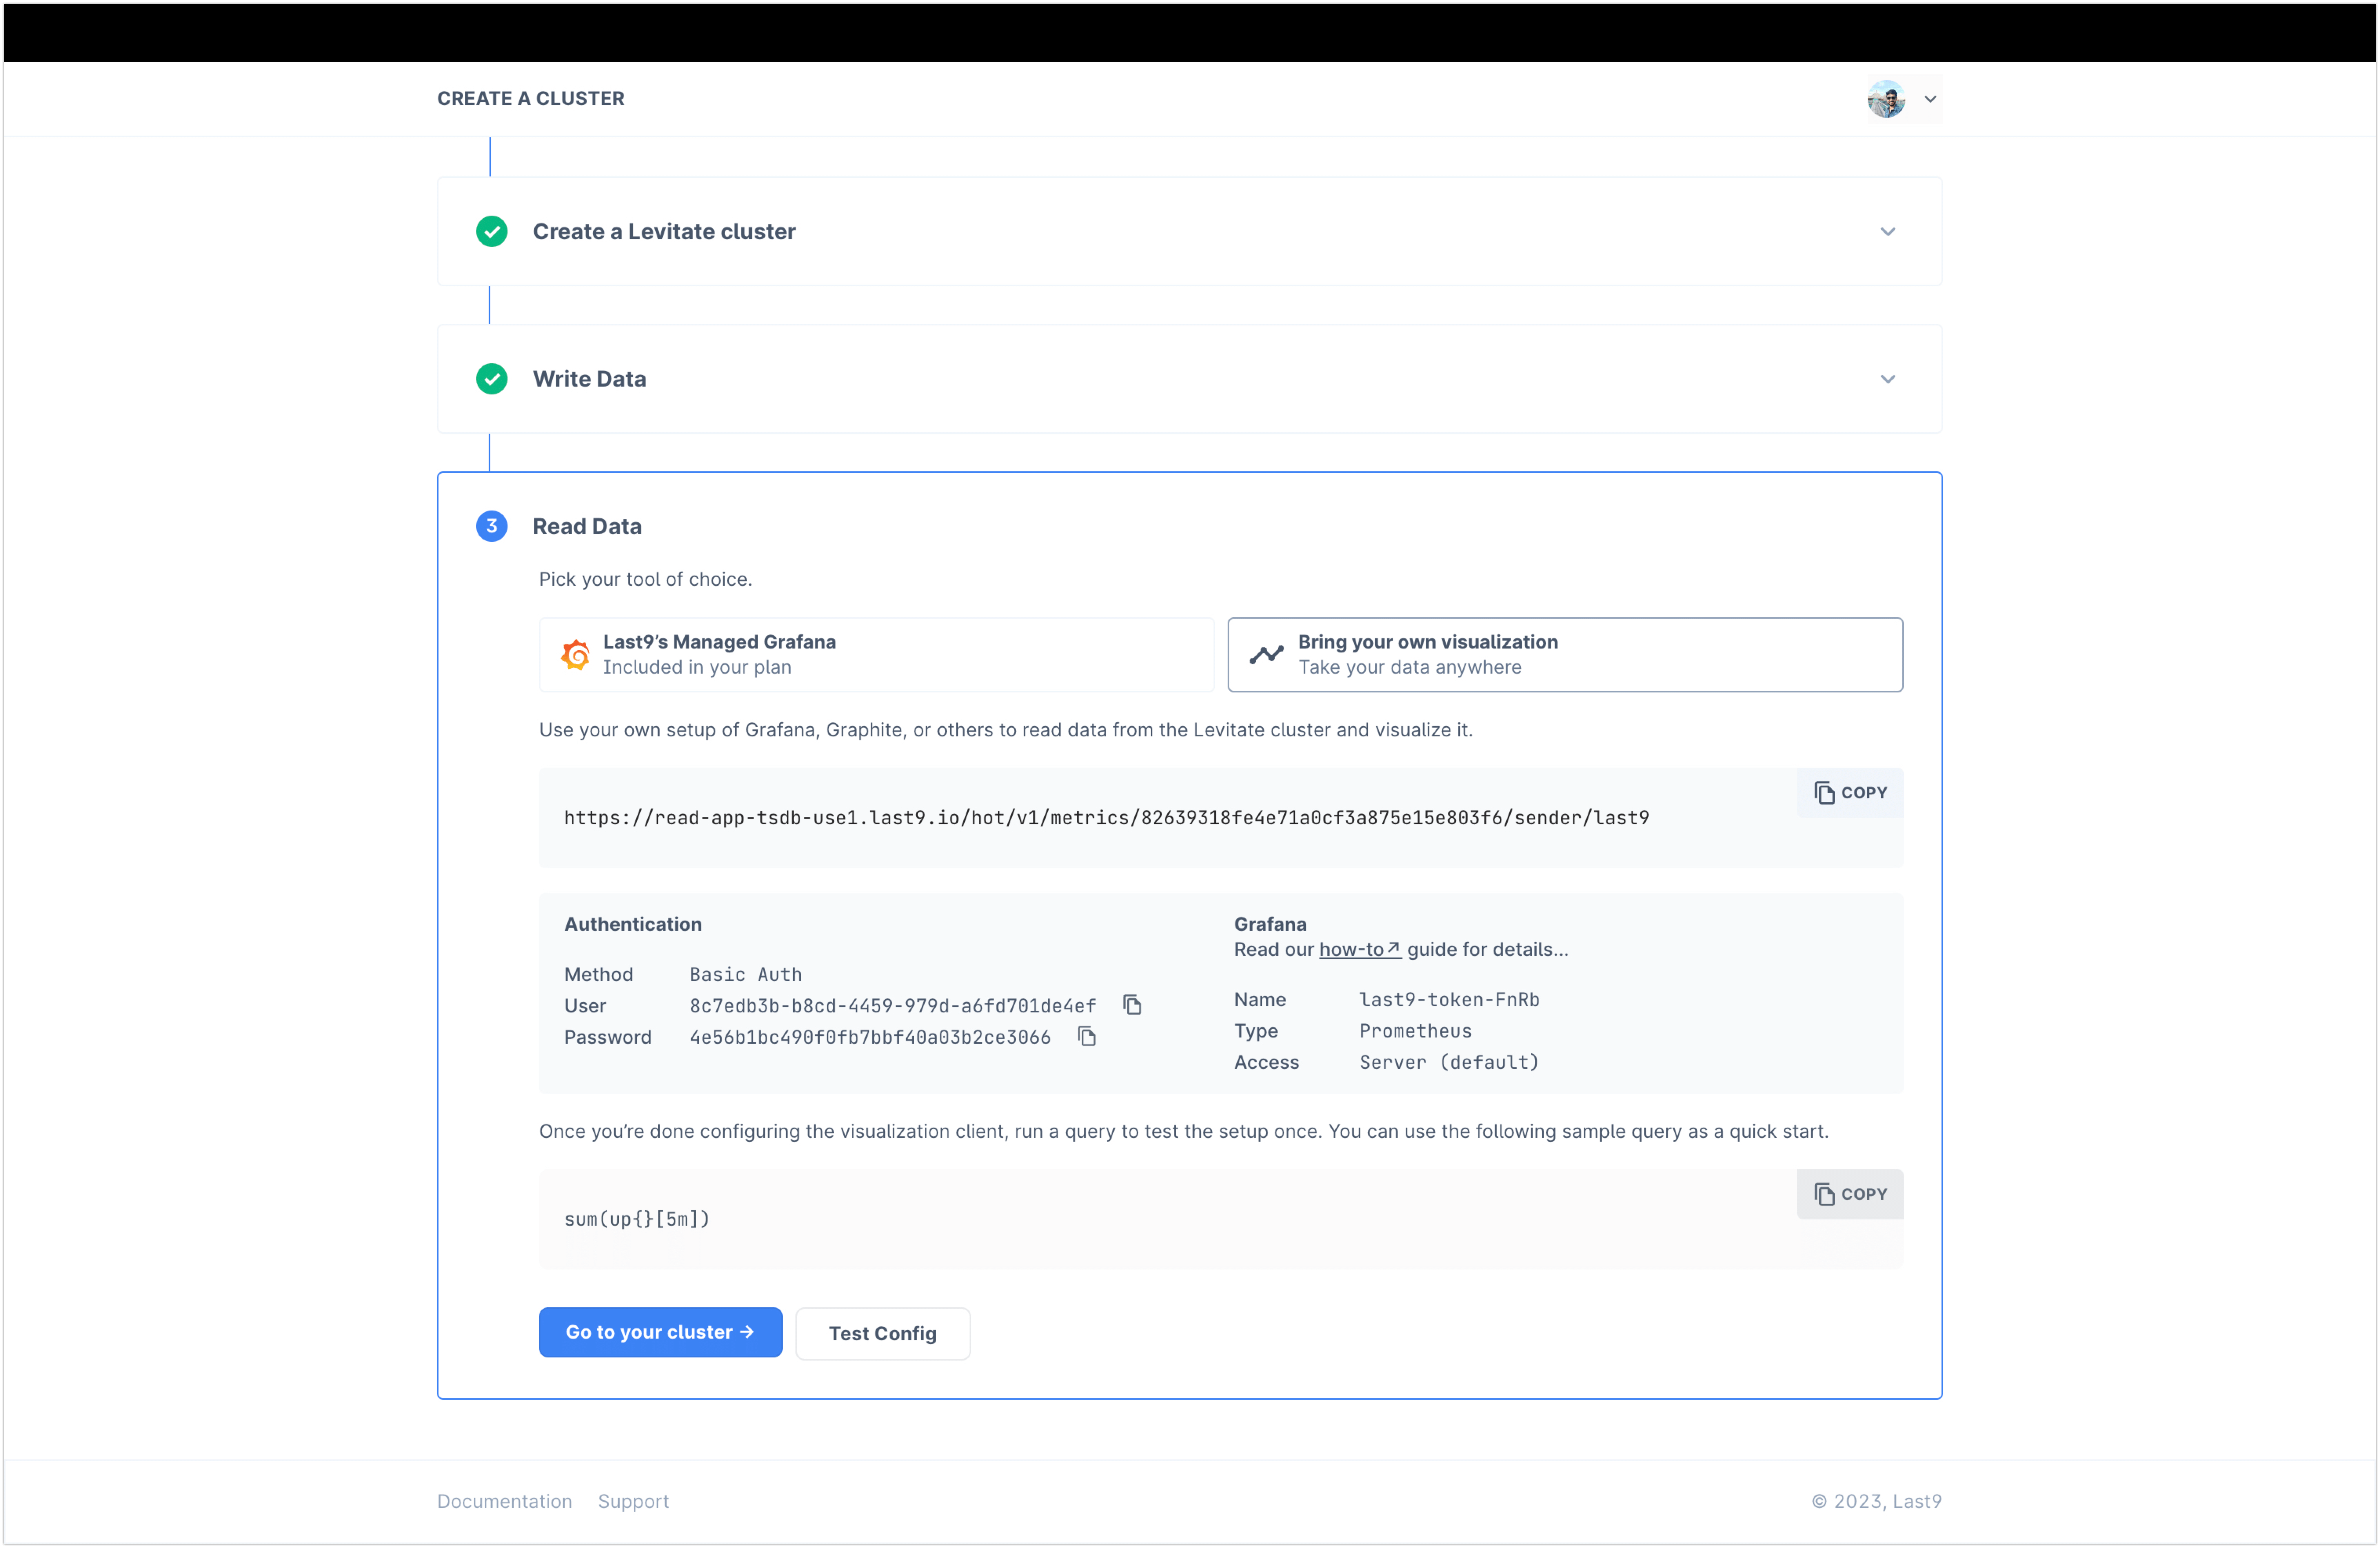
Start reading data from Last9
Use Managed Grafana, part of Last9, or read our How to configure Grafana for Last9 guide.
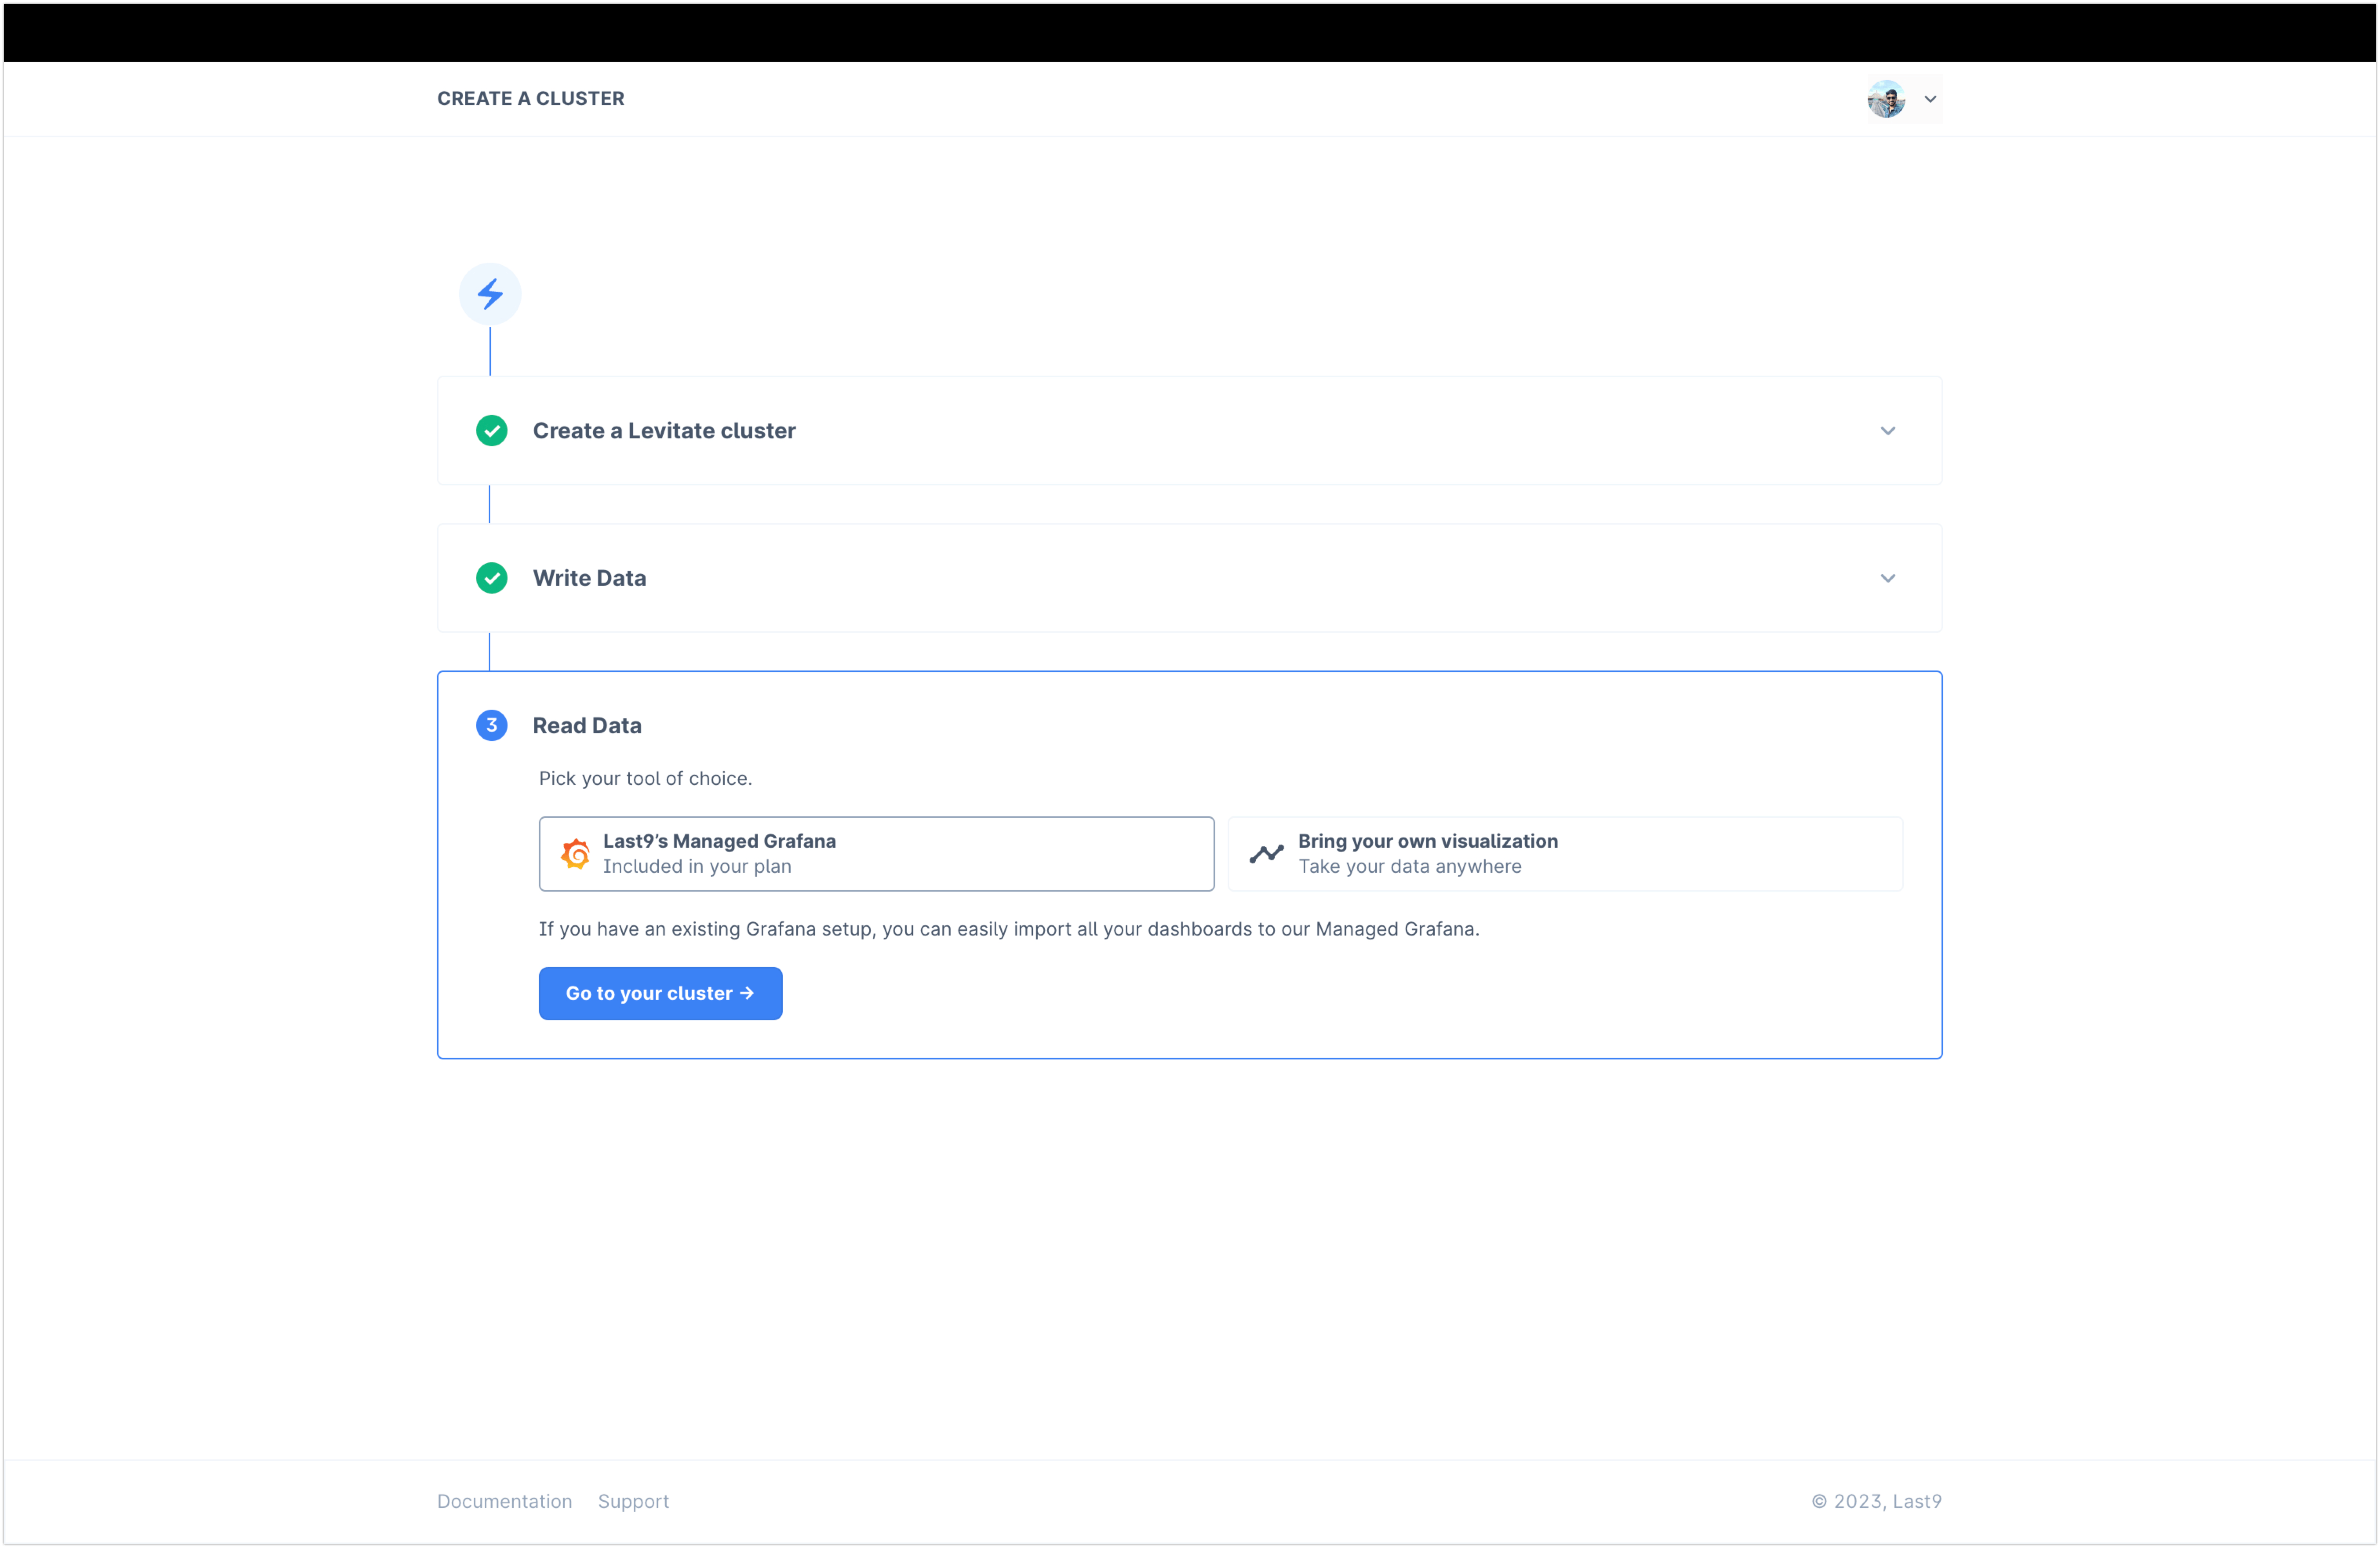
With these simple steps, you have a fully operational Last9 cluster to be used as a metrics database. Invite your team members to Last9, create new clusters, or set up alerts.