Streaming Aggregation
This document explains how to setup streaming aggregation pipelines in Last9.
Why Streaming Aggregation?
Streaming Aggregation can help handle multiple use cases around managing high cardinality metrics. Time Series Databases run into high cardinality metrics due to the advent of cloud-native setups and microservices. Last9 has superior defaults for high cardinality, which are as generous as 1M time series per metric per hour.
But the question remains: what to do when the cardinality limits are hit? How can you get meaningful answers from the TSDB without sacrificing cost and query performance?
Handling Cardinality Limits
Once the Cardinality limits are hit, one can handle it using multiple ways:
- Via relabeling
- By dropping labels at the source
- By changing instrumentation to not emit the labels in the first place
- Increasing resources and infrastructure results in costs blowing up
All of these options have the same problems:
- They require changes on the customer side, either on the configuration or code side
- They rob customers of getting the answers from their metrics. Imagine a
podlabel, which is breaking the cardinality limit but is extremely important for overall system monitoring. Losing out on it will mean that a part of the system's health is suddenly absent in the monitoring setup
Streaming Aggregation can handle this use case by defining a rule to drop specific labels and creating new metrics. The only change needed is to define a PromQL for the streaming aggregation on Last9. No change is required on the customer side, code or configuration. This solves the cardinality limit challenge, as the newly generated metric has reduced cardinality as you can drop specific labels in flight before the storage.
Keeping the visibility provided by High Cardinality labels
Imagine you have a metric with the following labels.
| Label | Cardinality |
|---|---|
| pod | 10000 |
| pod name | 10000 |
| instance | 100 |
| country | 300 |
| service | 30 |
The effective worst-case cardinality for this metric
becomes10000 * 10000 * 100 * 20 * 300 = 60 Trillion.
The high cardinality labels are pod and pod name. Let's create a streaming
aggregation without them. The aggregated metric contains only theinstance
country and service labels. The cardinality gets reduced to 100 * 300 * 30
which is just 0.9 Million.
But you don't want to lose out on the pod and pod name labels in the context
of service as it provides crucial information. You can create a second
aggregation with pod, pod nameandserviceThe cardinality gets reduced to
10000 * 10000 * 30 which is 3 Billion, much less than the earlier cardinality
of 60 Trillion.
These aggregations will yield two new metrics that can be combined together in a PromQL to help in correlation. So effectively, there is no loss of information but with a much smaller cardinality, which helps in performance.
You may be wondering how Streaming Aggregations are different from Recording Rules? The short answer is Streaming Aggregation works in real time before the storage whereas Recording Rules work after the storage.
Read our blog for more details for difference between Recording Rules and Streaming Aggregation.
How does Streaming Aggregation work
In a regular scenario, data is written to the store as it comes in. Once queried, the querier fetches the data, partitions it by time and groupers (if specified), and runs a mathematical operator to return the results. This is done every time the query is run.
Regular Query flow
Example for a query: sum by (type) (metric{}[3m])
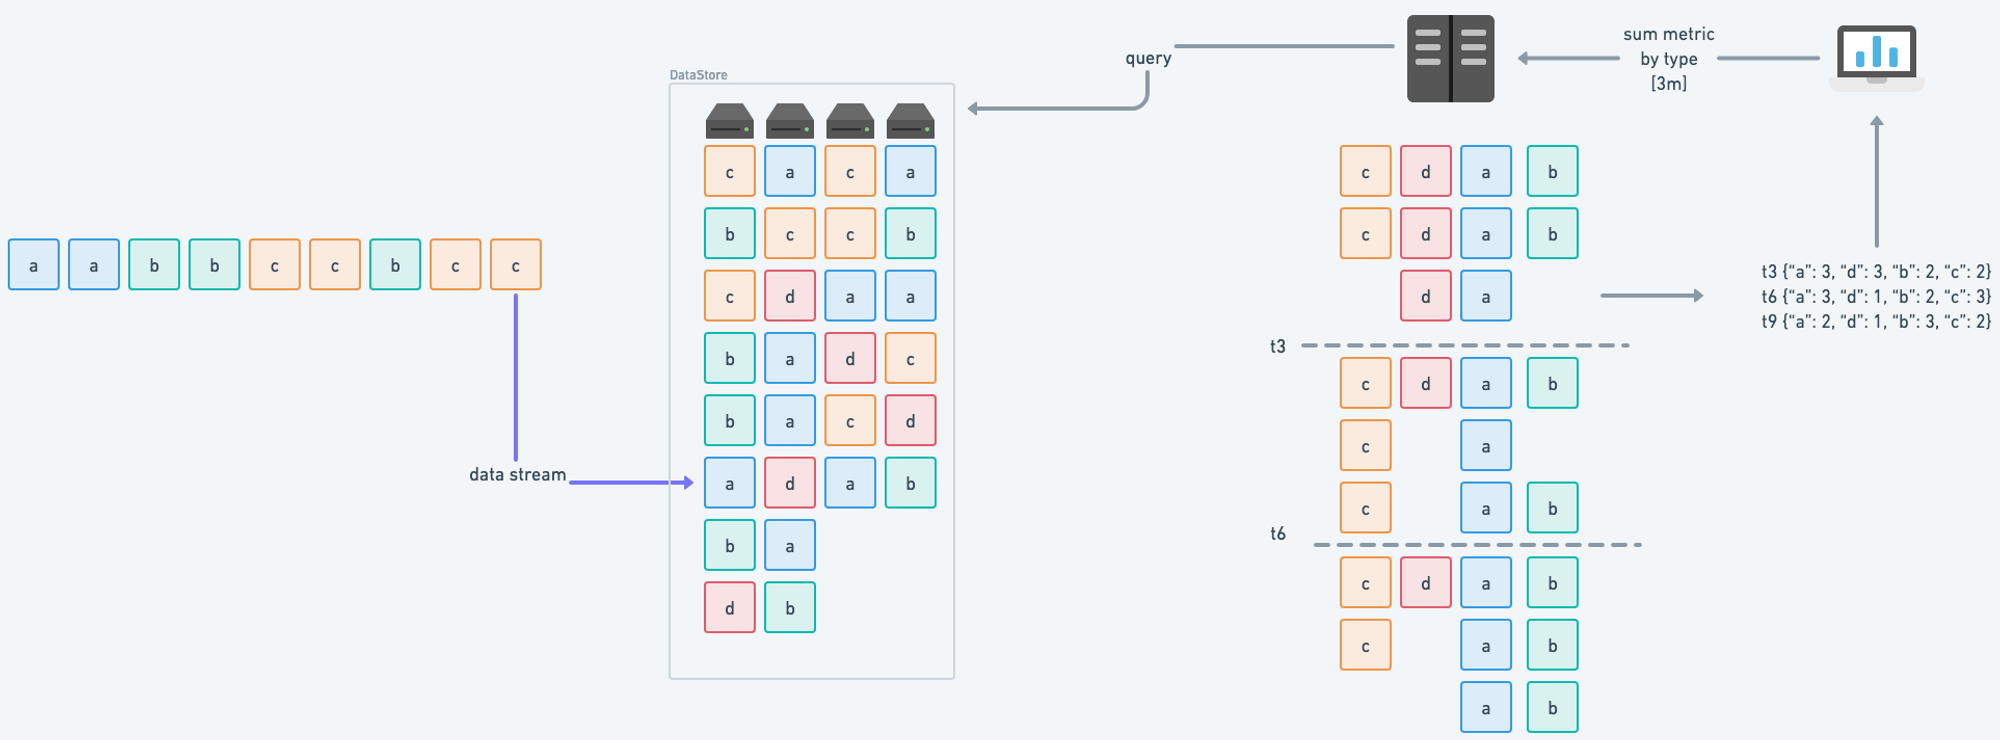
Scanning large and massive amounts of data can be slow and resource-consuming. It can slow down queries and overload the entire system, which can only handle a limited number of parallel queries.
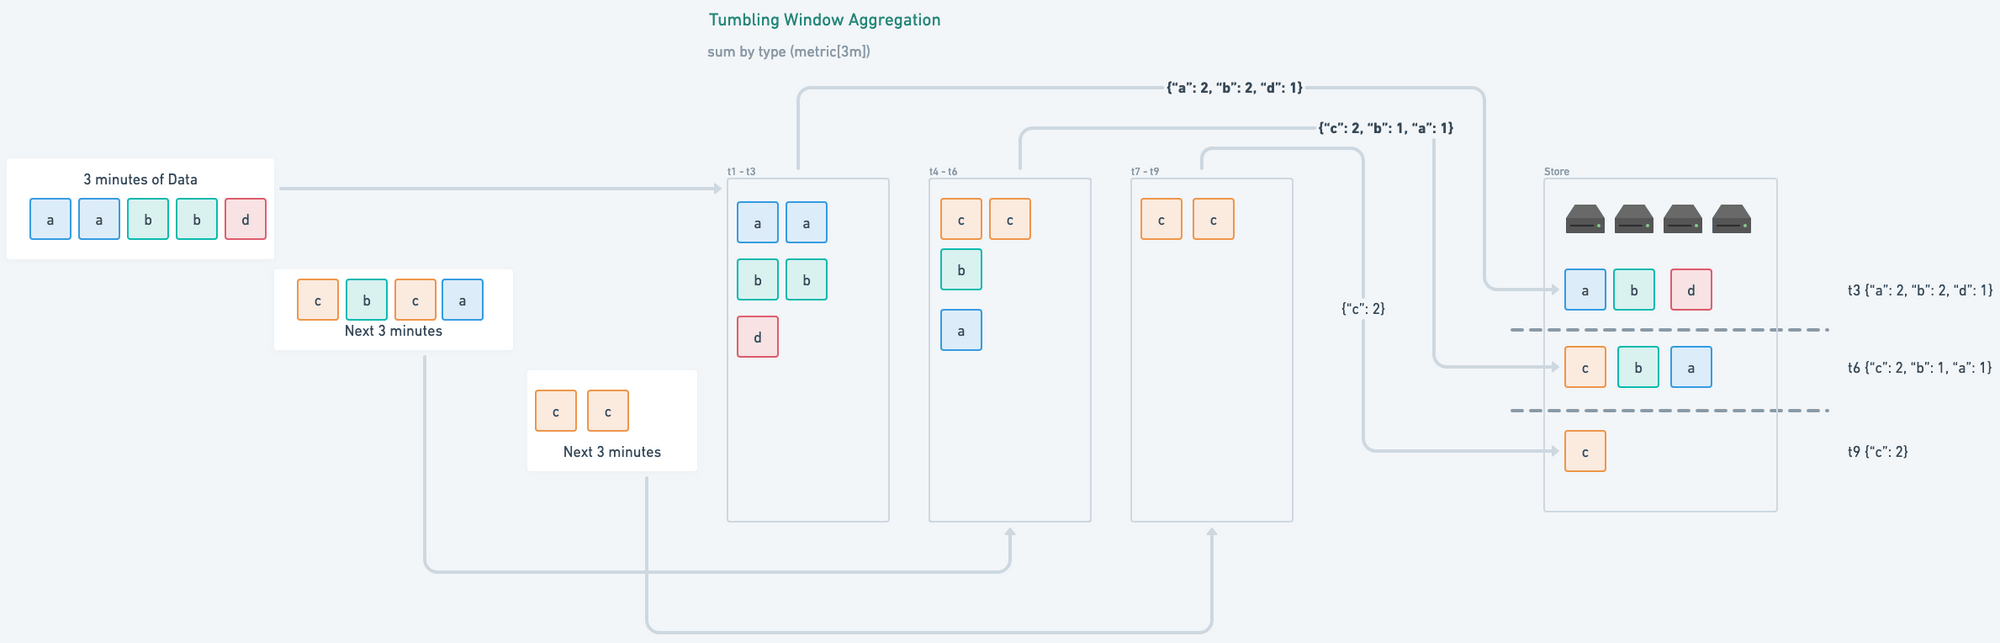
Pre-Aggregated Data
There are a few ways to expedite and reduce this load.
- Save and reuse the repeated queries, and only fetch the missing parts. This is called Delta-Caching and is already enabled for all Last9 clusters
- Keep increasing the resources to do computation and aggregation. Not recommended, otherwise you won't be here
- Use materialized views like constructs to rely on pre-aggregation
When you enable streaming aggregates in Last9, the most expensive queries are
combined ahead of time, and the resulting metric is saved in the storage so
that it can be used as any other time series.
Here's the query we had earlier asked for sum by (type) (metric{}[3m]); If it
is pre-aggregated the query flow will be as follows.
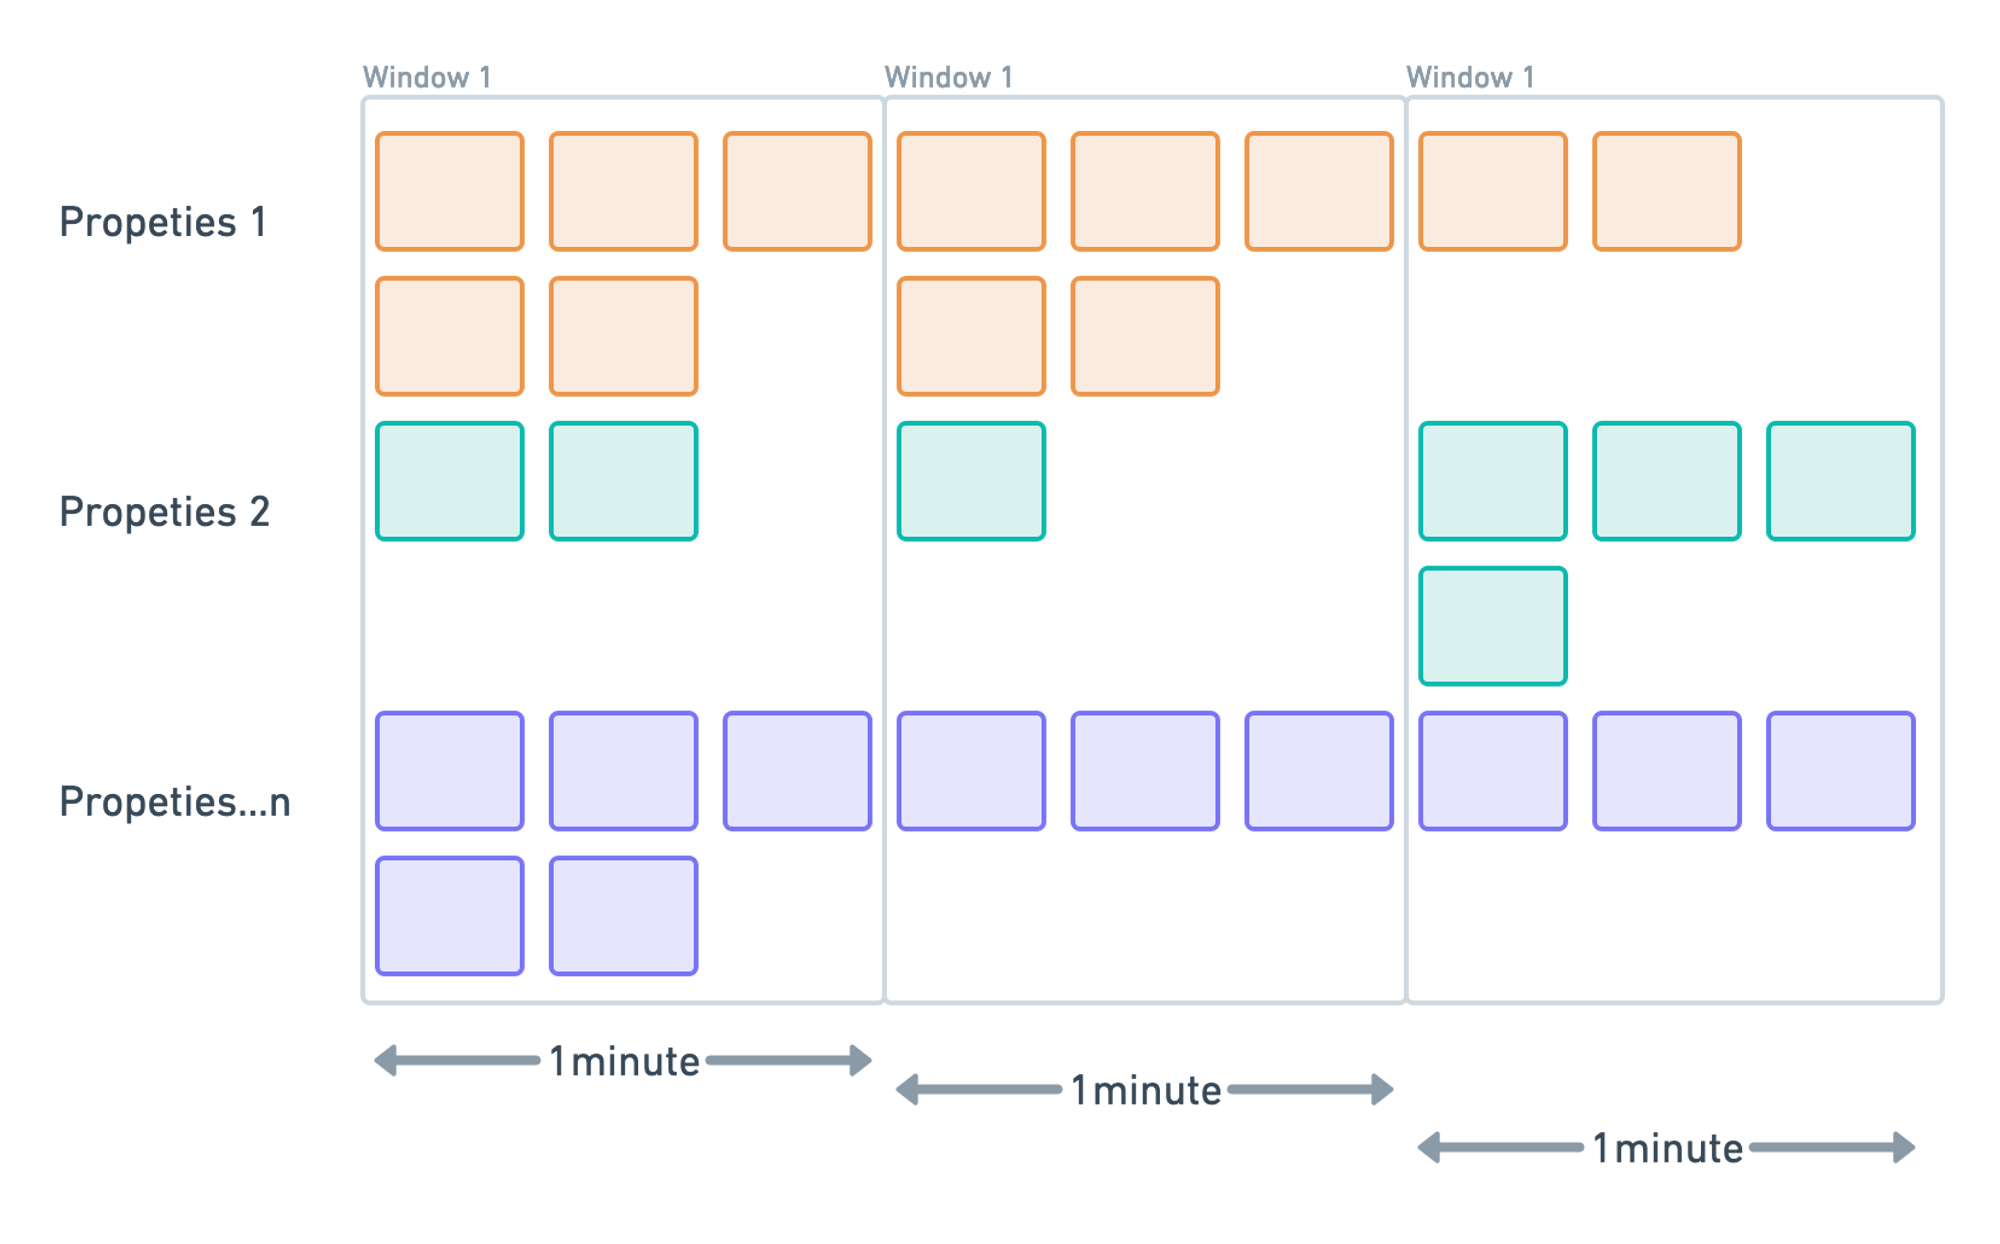
Tumbling Window Aggregation
We use
Tumbling Windows
to represent the stream's consistent and separate time intervals. First, we
group all metrics into buckets of n minutes, which we specify using the[n] in
the aggregation and then group them by metric name + labels (or as properties in
case of events).
For instance, the samples with timestamp values\[0:00:00-0:01:00) are in the
first period. Samples with timestamp values \[0:01:00-0:02:00) are in the
second period. And so on.
Streaming Aggregation Workflow
Streaming aggregation is based on a GitOps-based flow where you can add definitions for aggregated queries which will be sent to Last9 via automatic CI/CD workflow. The Last9 team will provide the GitHub repository with predefined CI/CD workflows.
The step-by-step process to add new aggregation as is follows:
Define the PromQL for the aggregation
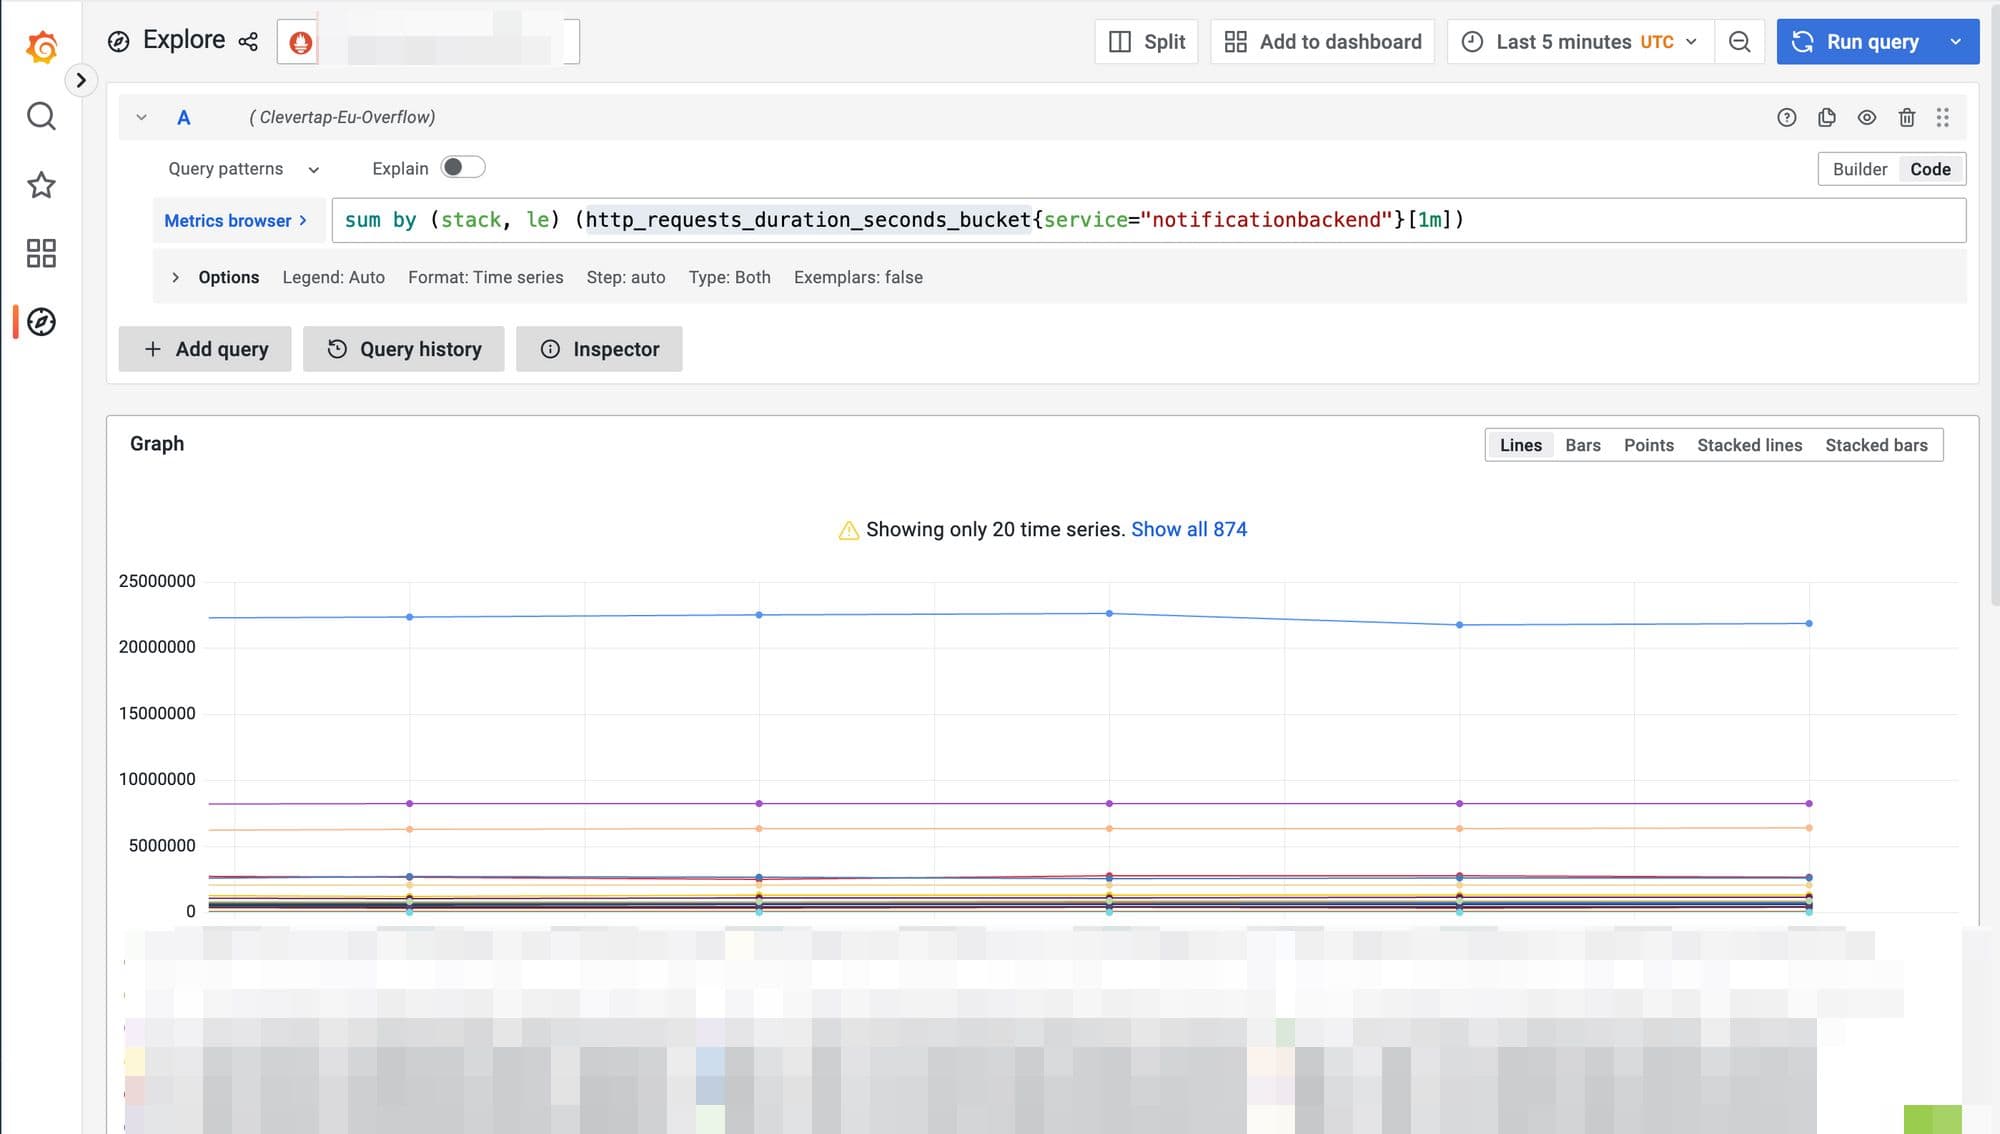
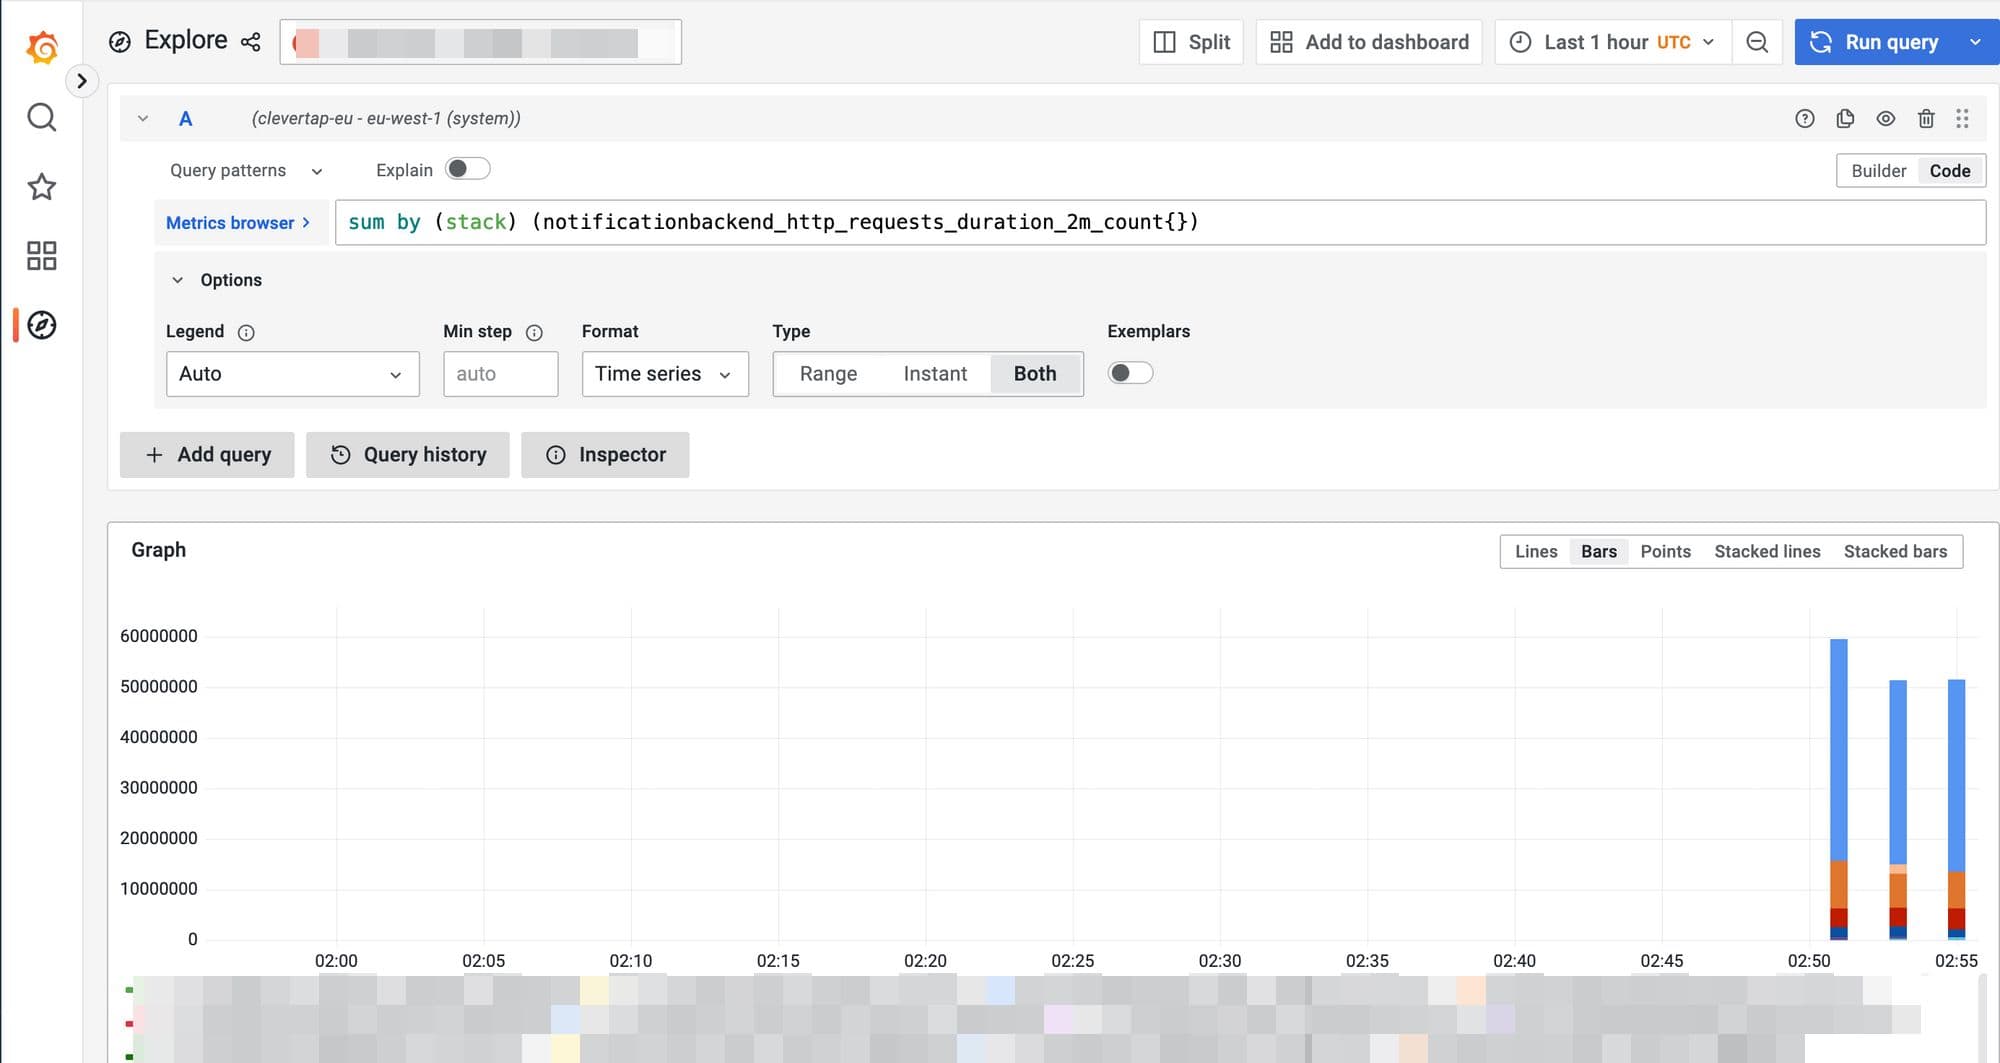
First, identify the target metric that you want to aggregate using the Explore tab in embedded Grafana.
We break down the metric with near-infinite cardinality into a query specific to our mission. For example, we sum the metric by stack in this case.
sum by (stack) (http_requests_duration_seconds_count{service="pushnotifs"}[1m])
The resultant time series running above PromQL is much less in cardinality and thus can help us if we save its result instead of the original data.
Adding the aggregation in the pipeline
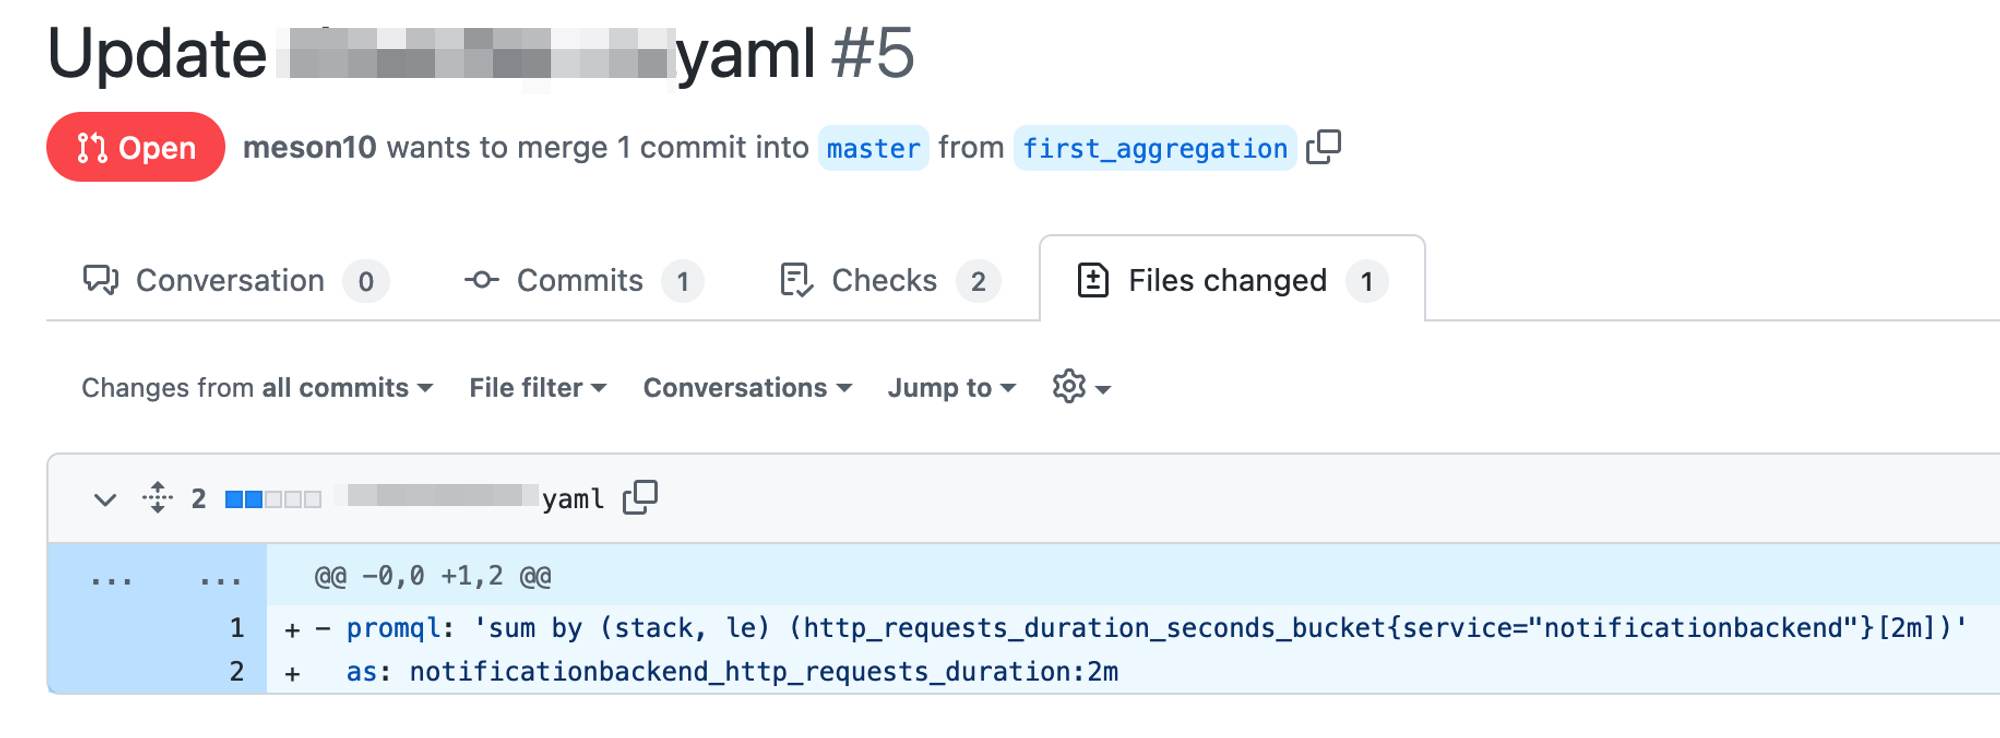
Let's attempt to save this as a streaming aggregate now by adding it to the YAML file for the Last9 cluster in which you are trying to apply the streaming aggregation.
- promql: 'sum by (stack, le) (http_requests_duration_seconds_bucket{service="pushnotifs"}[2m])'
  as: pushnotifs_http_requests_duration:2m
Last9 will emit the data as a new metric defined in the field. In this
example, the new metric will be named pushnotifs_http_requests_duration:2m.
Gitops based workflow
Create a Pull request to the GitHub repository with the updated rules.
Wait for the tests to pass to ensure that the streaming aggregations do not contain any syntax errors.
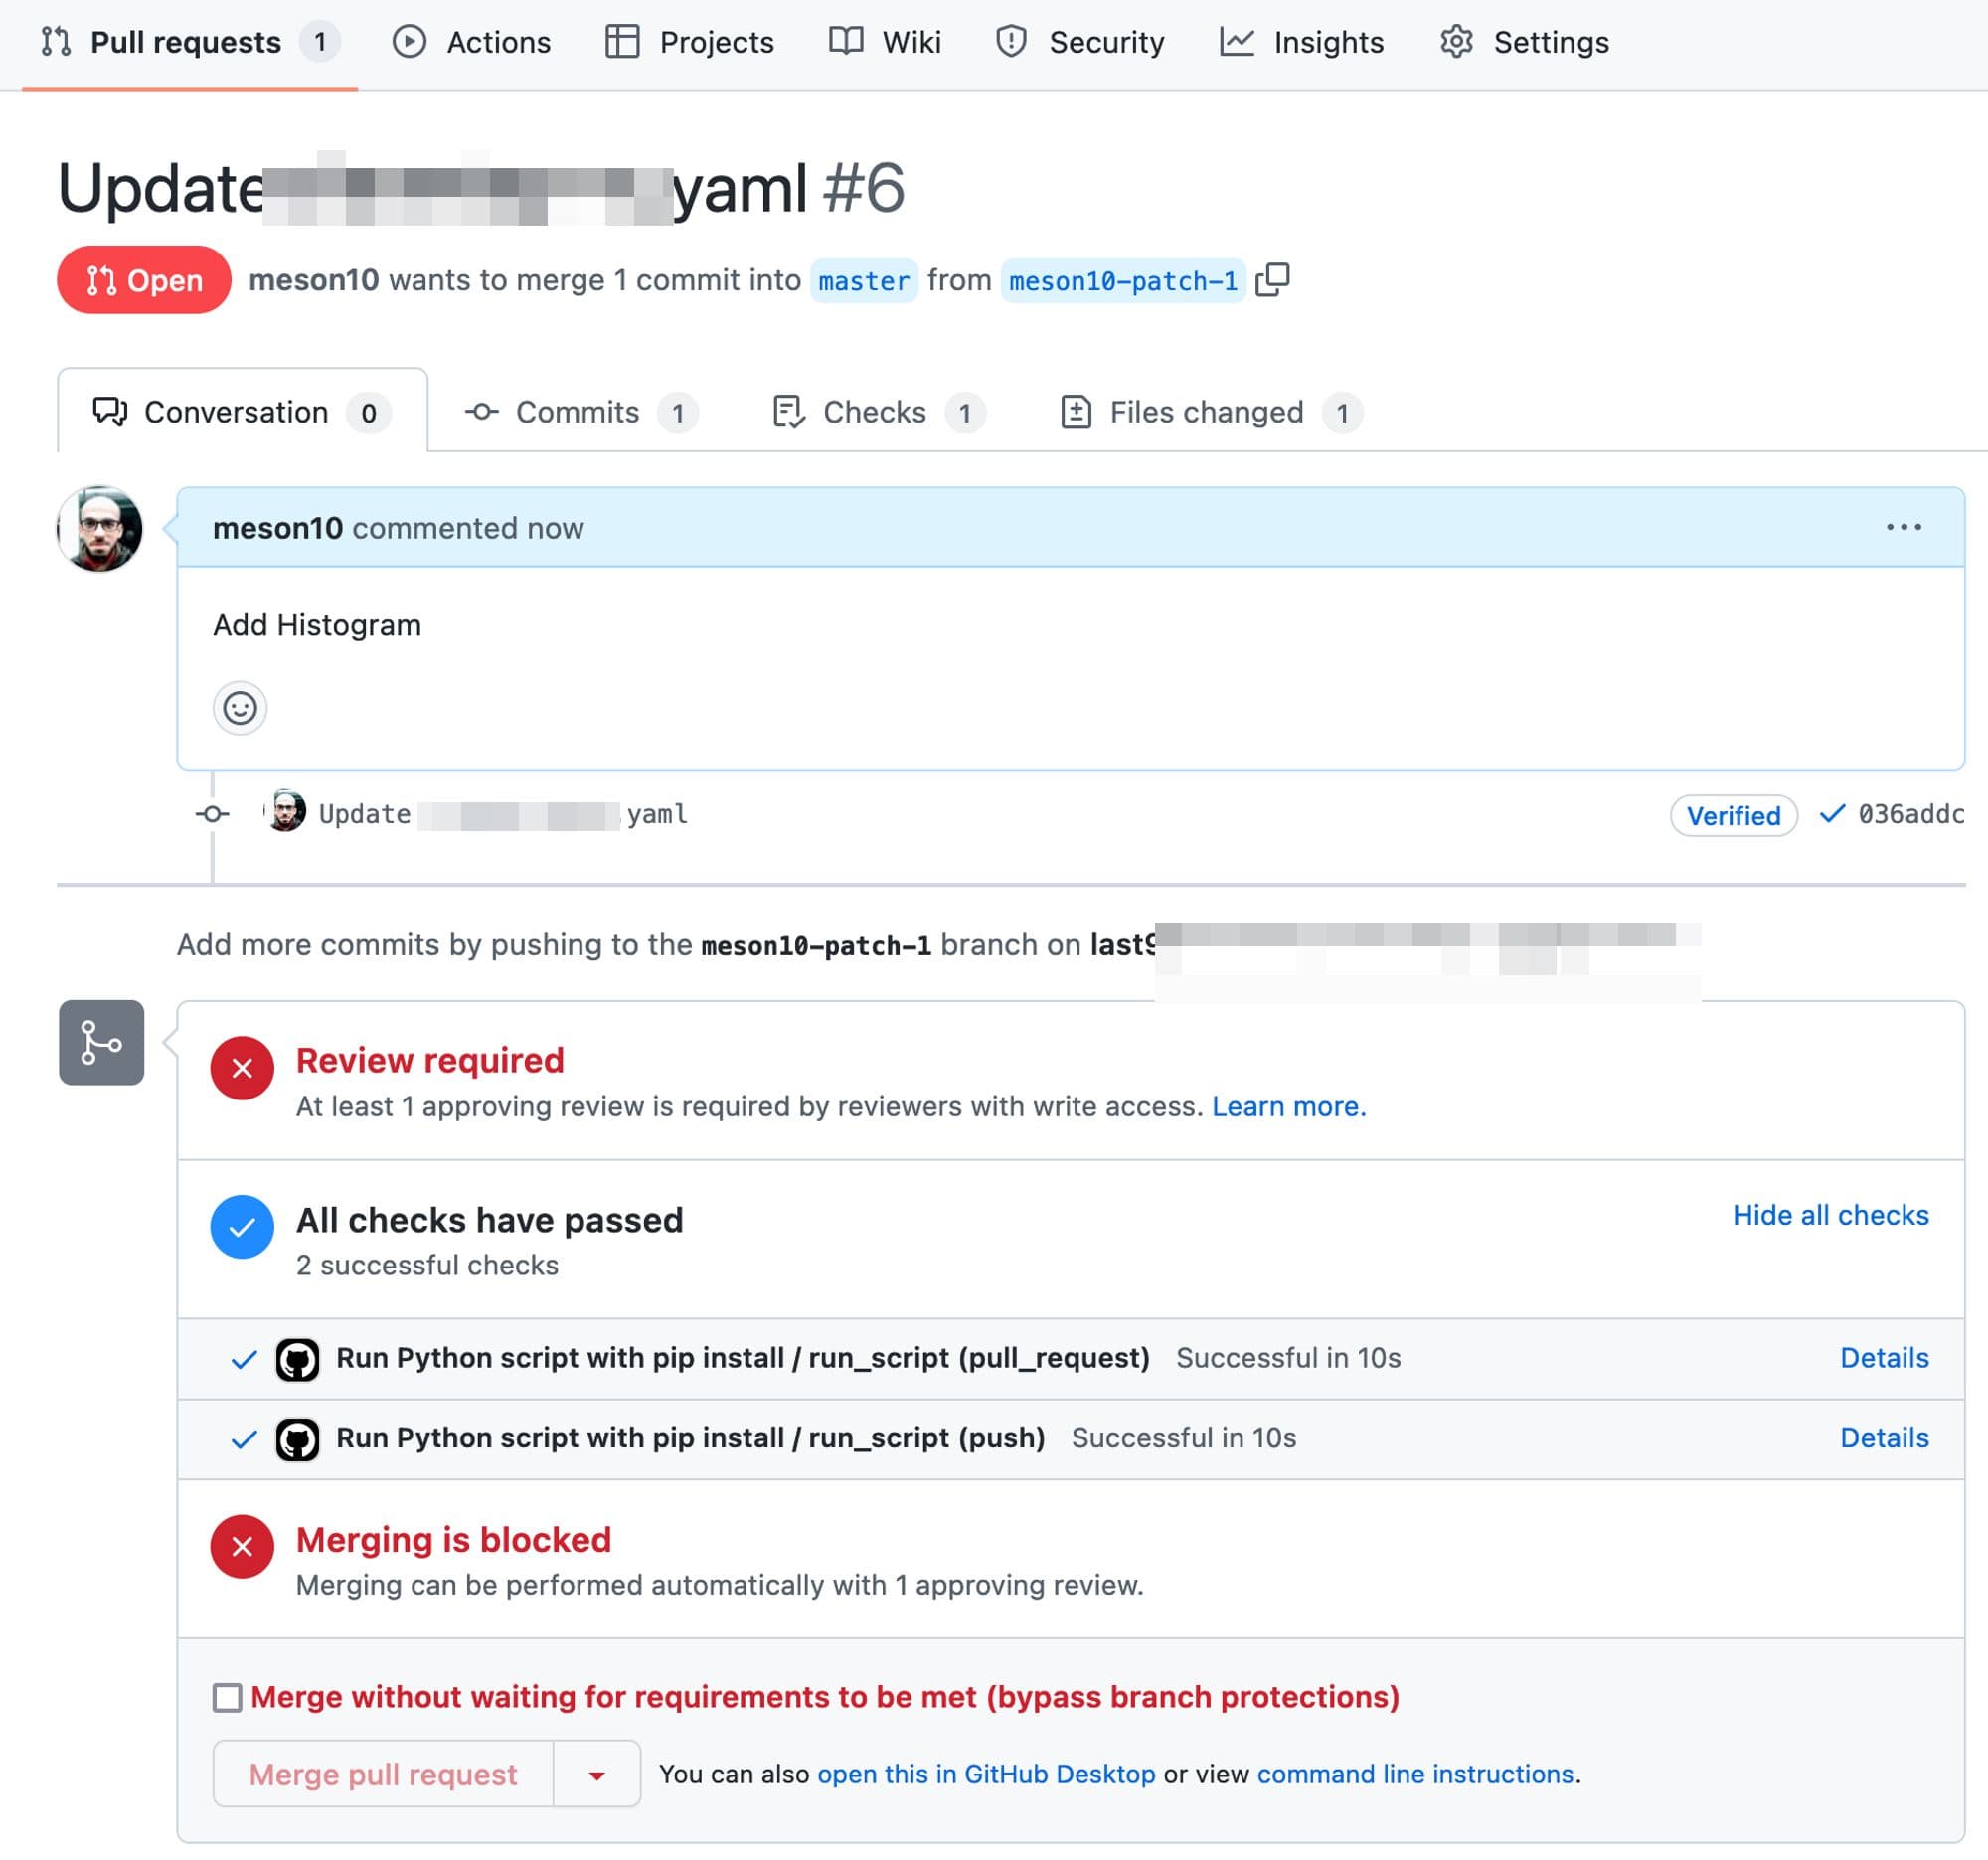
Merge the Pull Request for the CI/CD workflow to come into action and the pipeline to get activated on Last9.
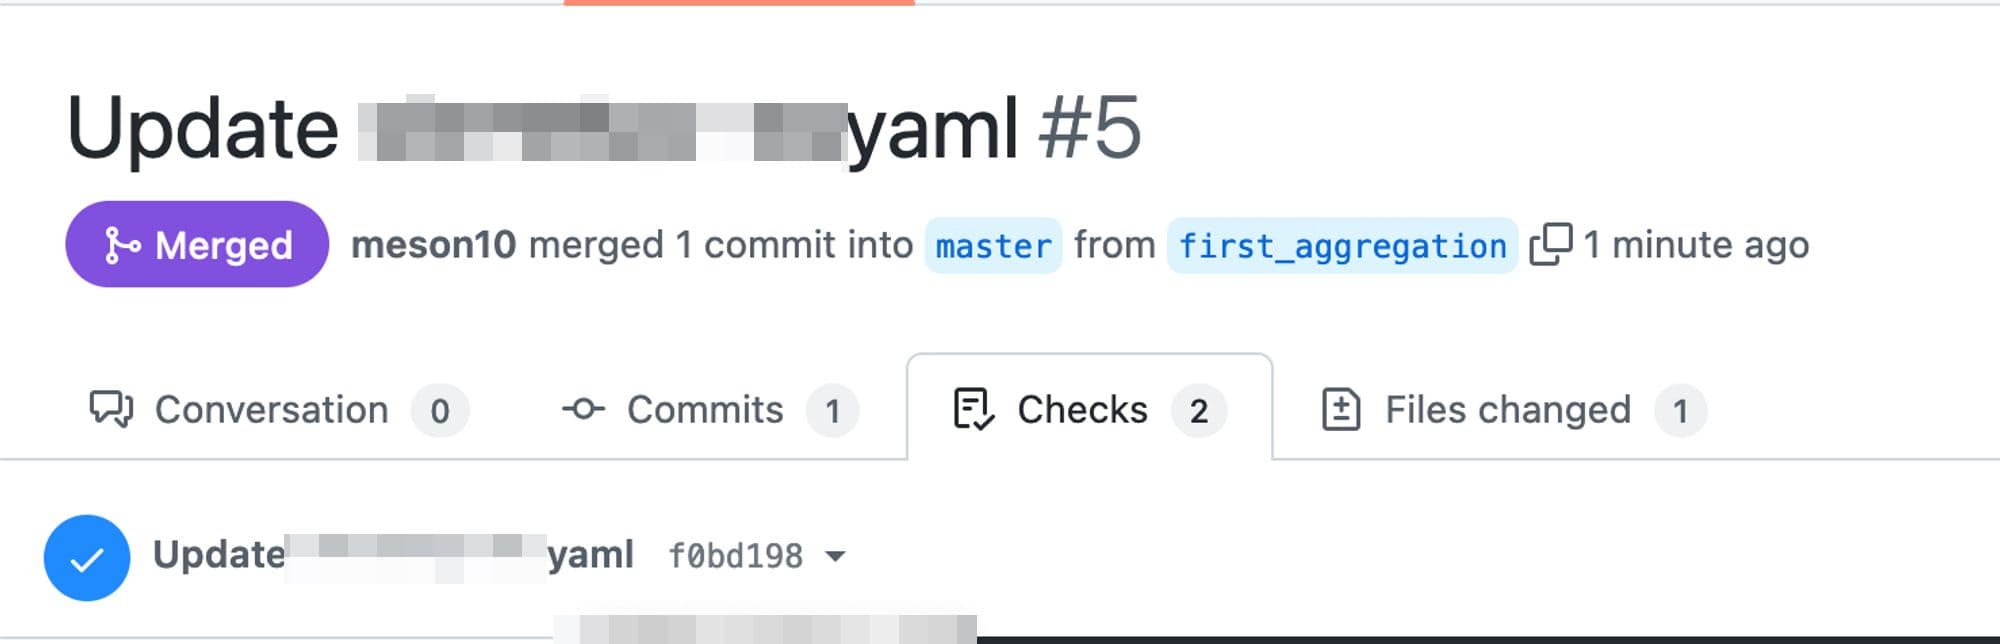
The new metric will then be available in the Last9 cluster, for which it was added in the Github repository.
Please note that streaming aggregations are limited to 3,000,000 per hour. Therefore, if a streaming aggregate generates more data than that, it will be skipped.
The new metrics can be queried now as it will be present in the Last9 cluster, in which Streaming Aggregation is addeed.
Achieving Complex Pipelines like Histograms using Streaming Aggregations
Effectively, a Histogram requires three metrics:
- <metric_name>_bucket
- <metric_name>_sum
- <metric_name>_count
They will work if the three can be streamed in the exact alignment.
Here’s the previous example, again changed to accommodate a Histogram.
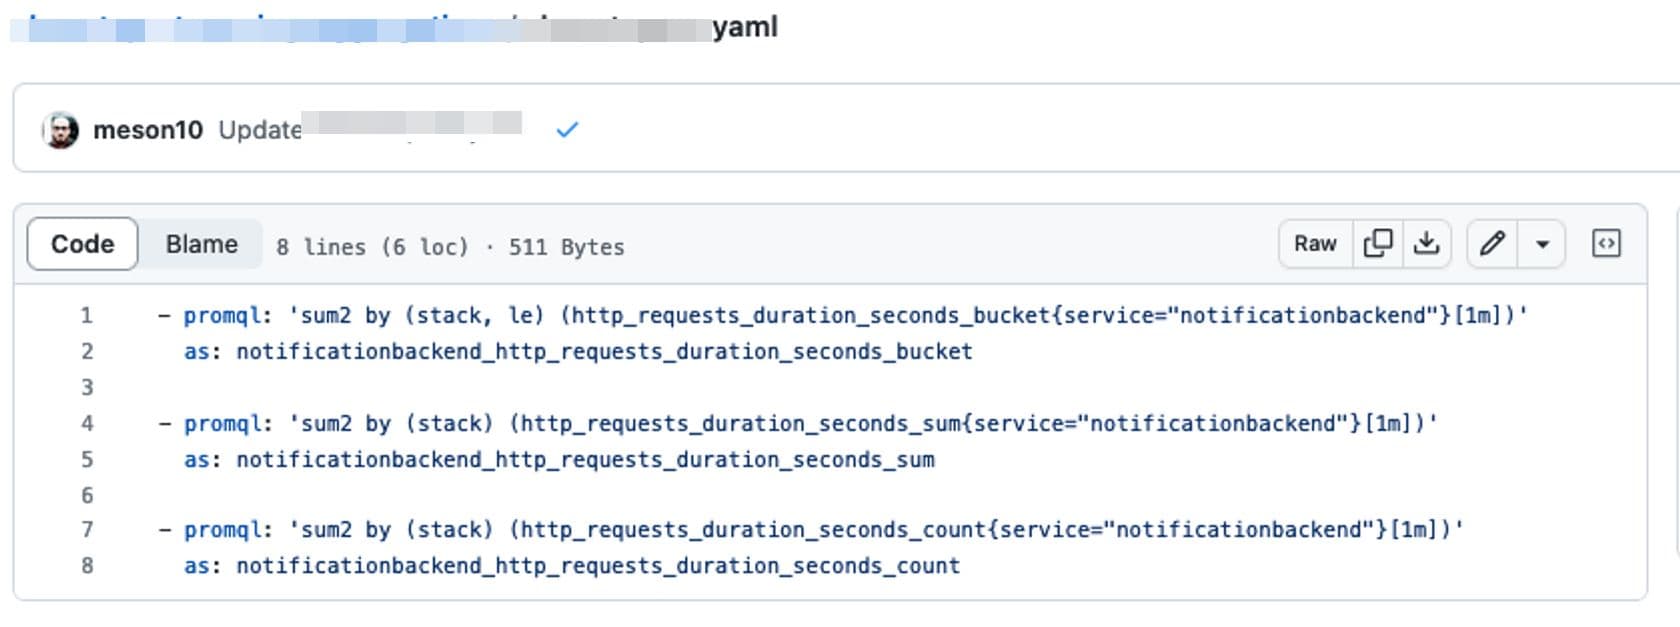
Instead of sum, please use the sum2 aggregator function when dealing with
counters. This aggregator is aware of counters and the fluctuations that can
happen during a reset.
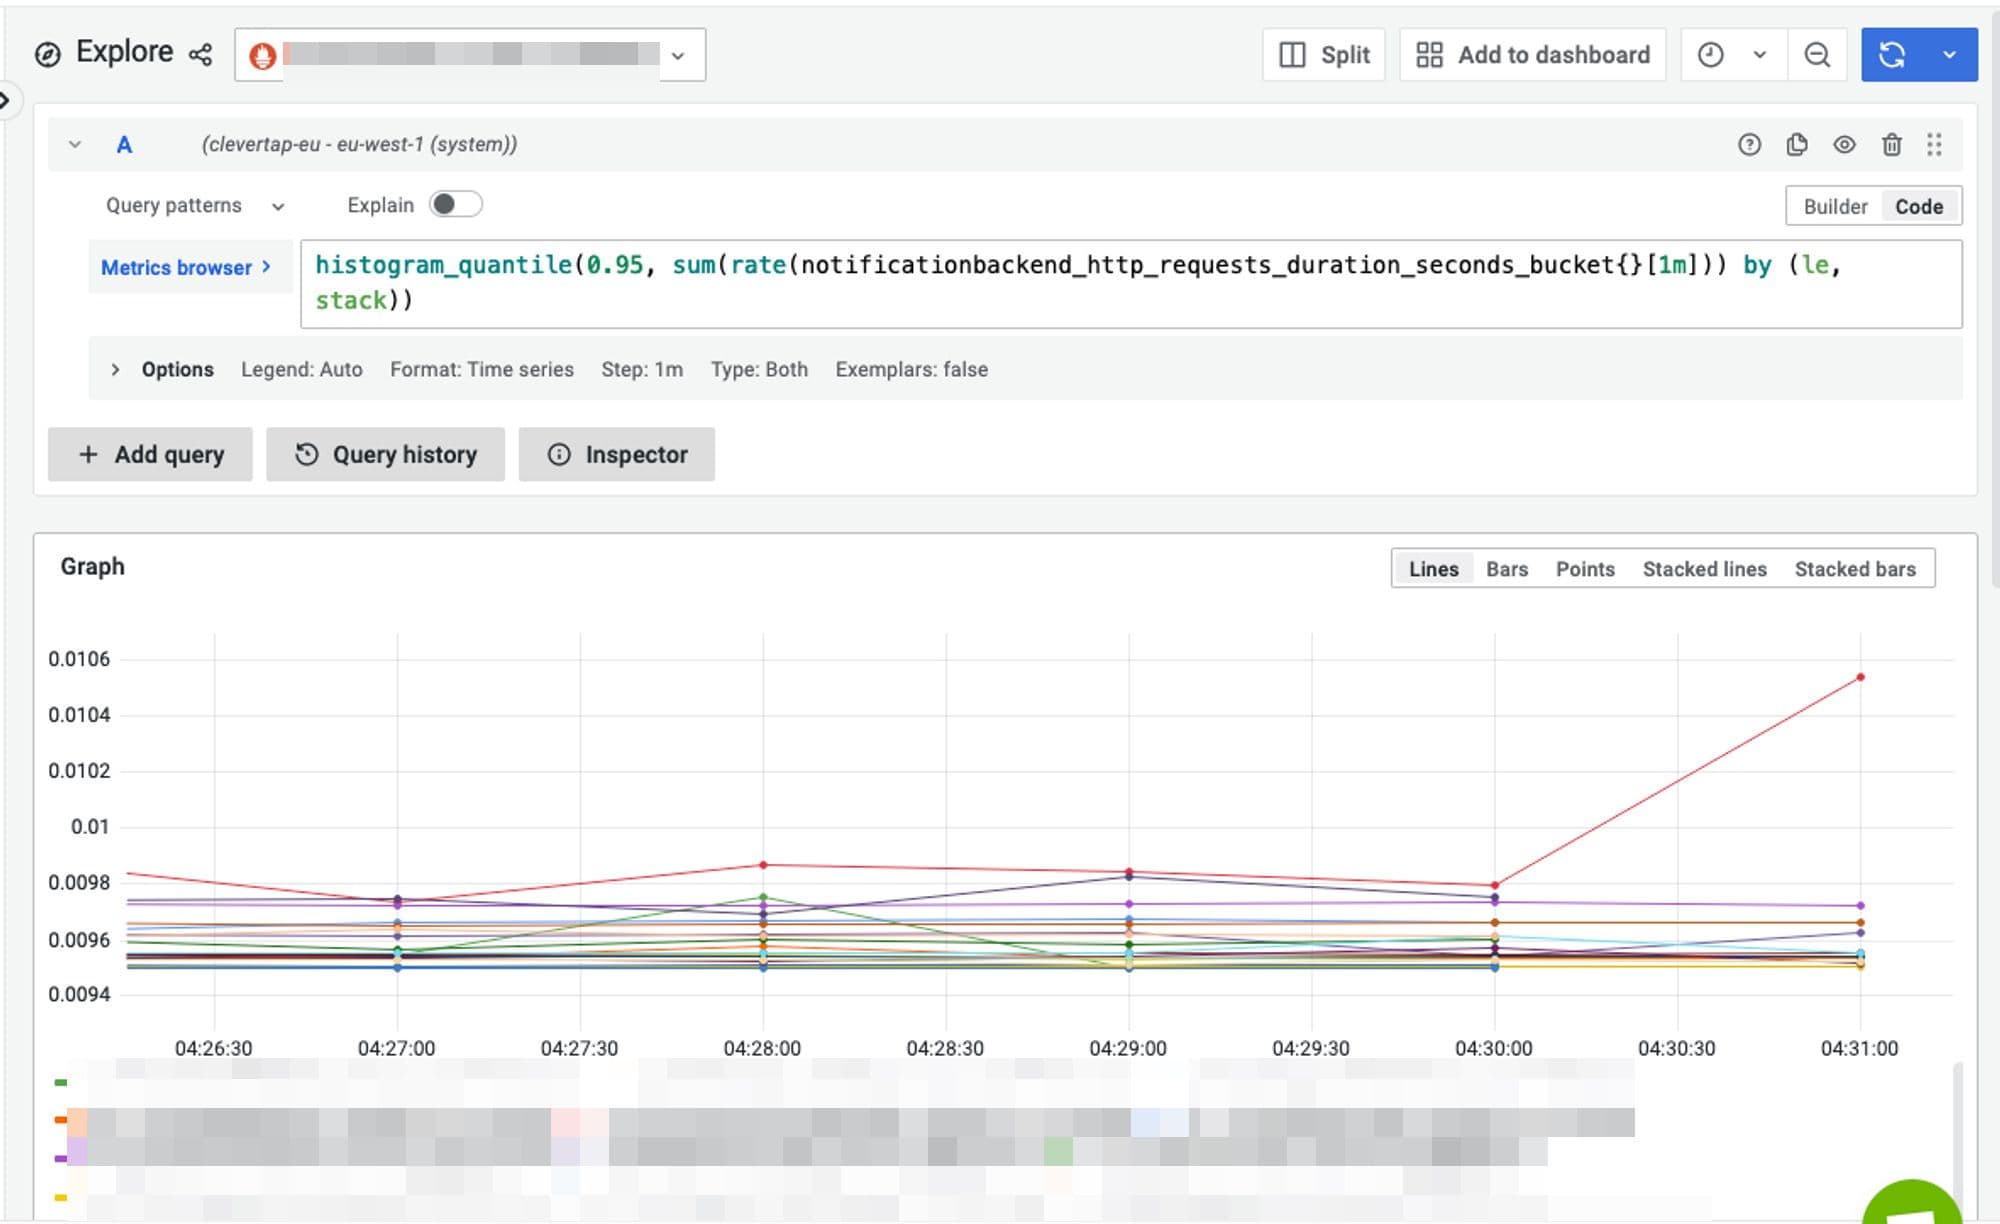
And we can execute histogram_quantile on the streamed metric.
A similar technique can also be used to roll up the data. Like in some of the above examples, we have chosen to sum over [2m] instead of [1m].
Supported Functions
Supported aggregation functions that are available in Streaming Aggregation are as follows.
| Function Name | Description |
|---|---|
| sum | Total to be used for other metric types |
| max | The Maximum value of the samples |
| sum2 | Sum, but for counters and reset awareness. |
| increase | The increase in counter value. |
| min | The minimum value of the samples |
| avg | The average value of the samples. |
Troubleshooting
Please get in touch with us on Discord or Email if you have any questions.