Monitor Node.js applications
Quickstart guide for monitoring Node.js applications using OpenAPM
To quickly get started with the OpenAPM in your Node.js application, follow the steps below:
Installation
npm install --save @last9/openapm@latest
OR
yarn add @last9/openapm@latest
Usage
OpenAPM needs to be initialized in the application as early as possible so that it starts a metrics server and can monitor your application from the get-go.
To initialize OpenAPM, import the OpenAPM class from the package
and create its instance. This will create a metrics server running by default on
http://localhost:9097. The metrics will be available on
http://localhost:9097/metrics.
import { OpenAPM } from "@last9/openapm";
const openapm = new OpenAPM();
Now, OpenAPM is ready to instrument the application packages using the
.instrument() method.
Instrumentation
Currently, OpenAPM supports the following frameworks and databases.
We will keep adding support for more packages. Feel free to request a feature here.
Express
Call the instrument method before initializing the Express application as
below.
openapm.instrument("express");

// Create application after the openapm initialization
const app = express();

// ...

app.listen(3000);
This will instrument all HTTP requests from the Express application
and emit the Rate, Errors, Duration (RED) metrics.
These metrics will be available on http://localhost:9097/metrics.
MySQL
OpenAPM supports instrumenting the mysql2
package. This means all the ORMs that use the mysql2 package internally will
get instrumented.
openapm.instrument("mysql");
The database query metrics will be exposed on the /metrics route on the
metrics server.
NestJS
OpenAPM supports instrumenting @nestjs/core v4 and above.
import { NestFactory } from "@nestjs/core";
import { AppModule } from "./app.module";
import { OpenAPM } from "@last9/openapm";

async function bootstrap() {
  const openapm = new OpenAPM();
  openapm.instrument("nestjs");

  const app = await NestFactory.create(AppModule);
  await app.listen(3000);
}
bootstrap();
The Rate, Errors, Duration (RED) metrics for all the HTTP requests in the application will be emitted by default.
Configuration
You can customize the default behavior of OpenAPM by providing specific options described below.
const openapm = new OpenAPM({
  // Options go here
});
-
path: The path at which the metrics will be served. Defaults to/metrics. -
metricsServerPort: (Optional) The port at which the metricsServer will run. Defaults to9097. -
environment: (Optional) The application environment. Defaults toproduction. -
defaultLabels: (Optional) Any default labels to be included. -
requestsCounterConfig: (Optional) Requests counter configuration, same as Counter inprom-client. Defaults to{
name: 'http_requests_total',
help: 'Total number of requests',
labelNames: ['path', 'method', 'status'],
} -
requestDurationHistogramConfig: (Optional) Requests Duration histogram configuration, the same as Histogram inprom-client. Defaults to{
name: 'http_requests_duration_milliseconds',
help: 'Duration of HTTP requests in milliseconds',
labelNames: ['path', 'method', 'status'],
buckets: promClient.exponentialBuckets(0.25, 1.5, 31),
} -
extractLabels: (Optional) Extract labels from URL path params.// To extract from the URL params
{
...
extractLabels: {
tenant: { // Here, 'tenant' is the label name
from: 'params',
key: 'org' // Which key to extract from the params
mask: ':org' // Replacement string
}
}
} -
excludeDefaultLabels: (Optional) Provide labels to exclude from the default labels emitted by OpenAPM.
{
  ...
  excludeDefaultLabels: ['environment', 'version']
}
levitateConfig: (Optional) Configuration for Last9. Adding this configuration will enable the Change Events such as application lifecycle events.
{
   ...
   levitateConfig: {
      host: 'https://play.last9.io',
      orgSlug: 'acme', /** The slug can be obtained from the Last9 dashboard.*/
      dataSourceName: 'data-source', /** The data source can be obtained from the data source pages in the Last9 dashboard*/
      refreshTokens: {
         write: '0d2a1a9aXXX' /** You can get this from the API access page on Last9 dashboard*/
      }
   }
}
Storing Metrics
Metrics emitted by the OpenAPM library can be scraped by the Prometheus agent and sent to remote write storage like Last9. Follow the guide here to know more.
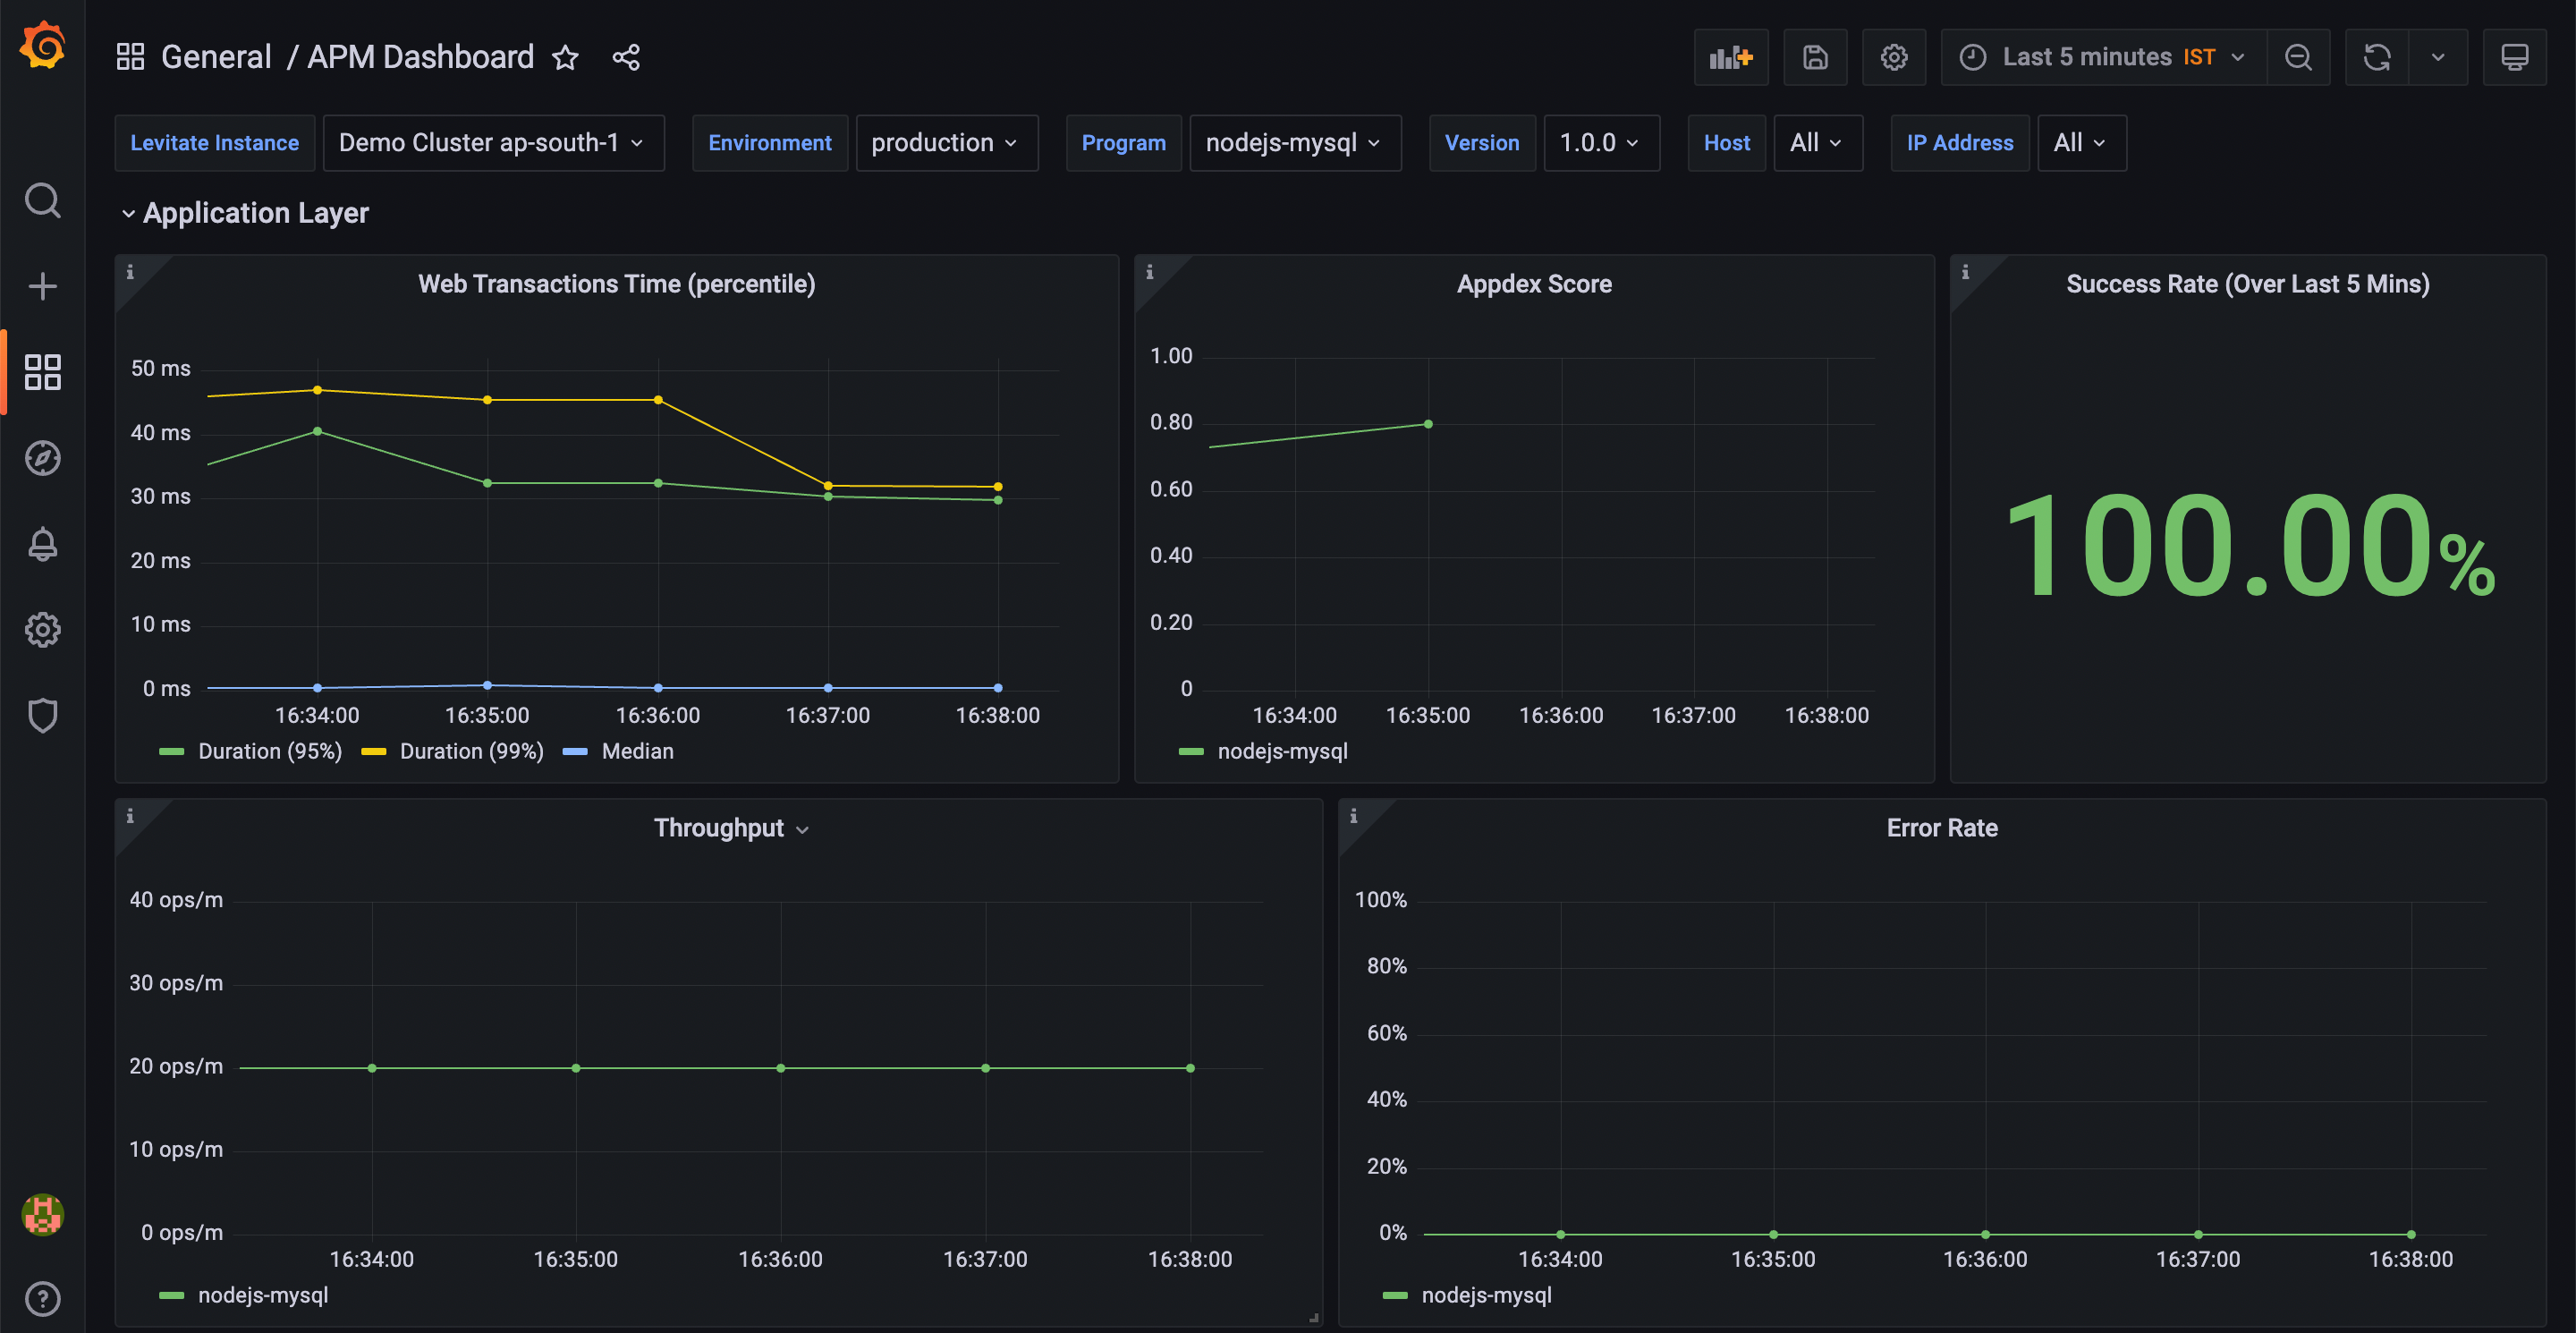
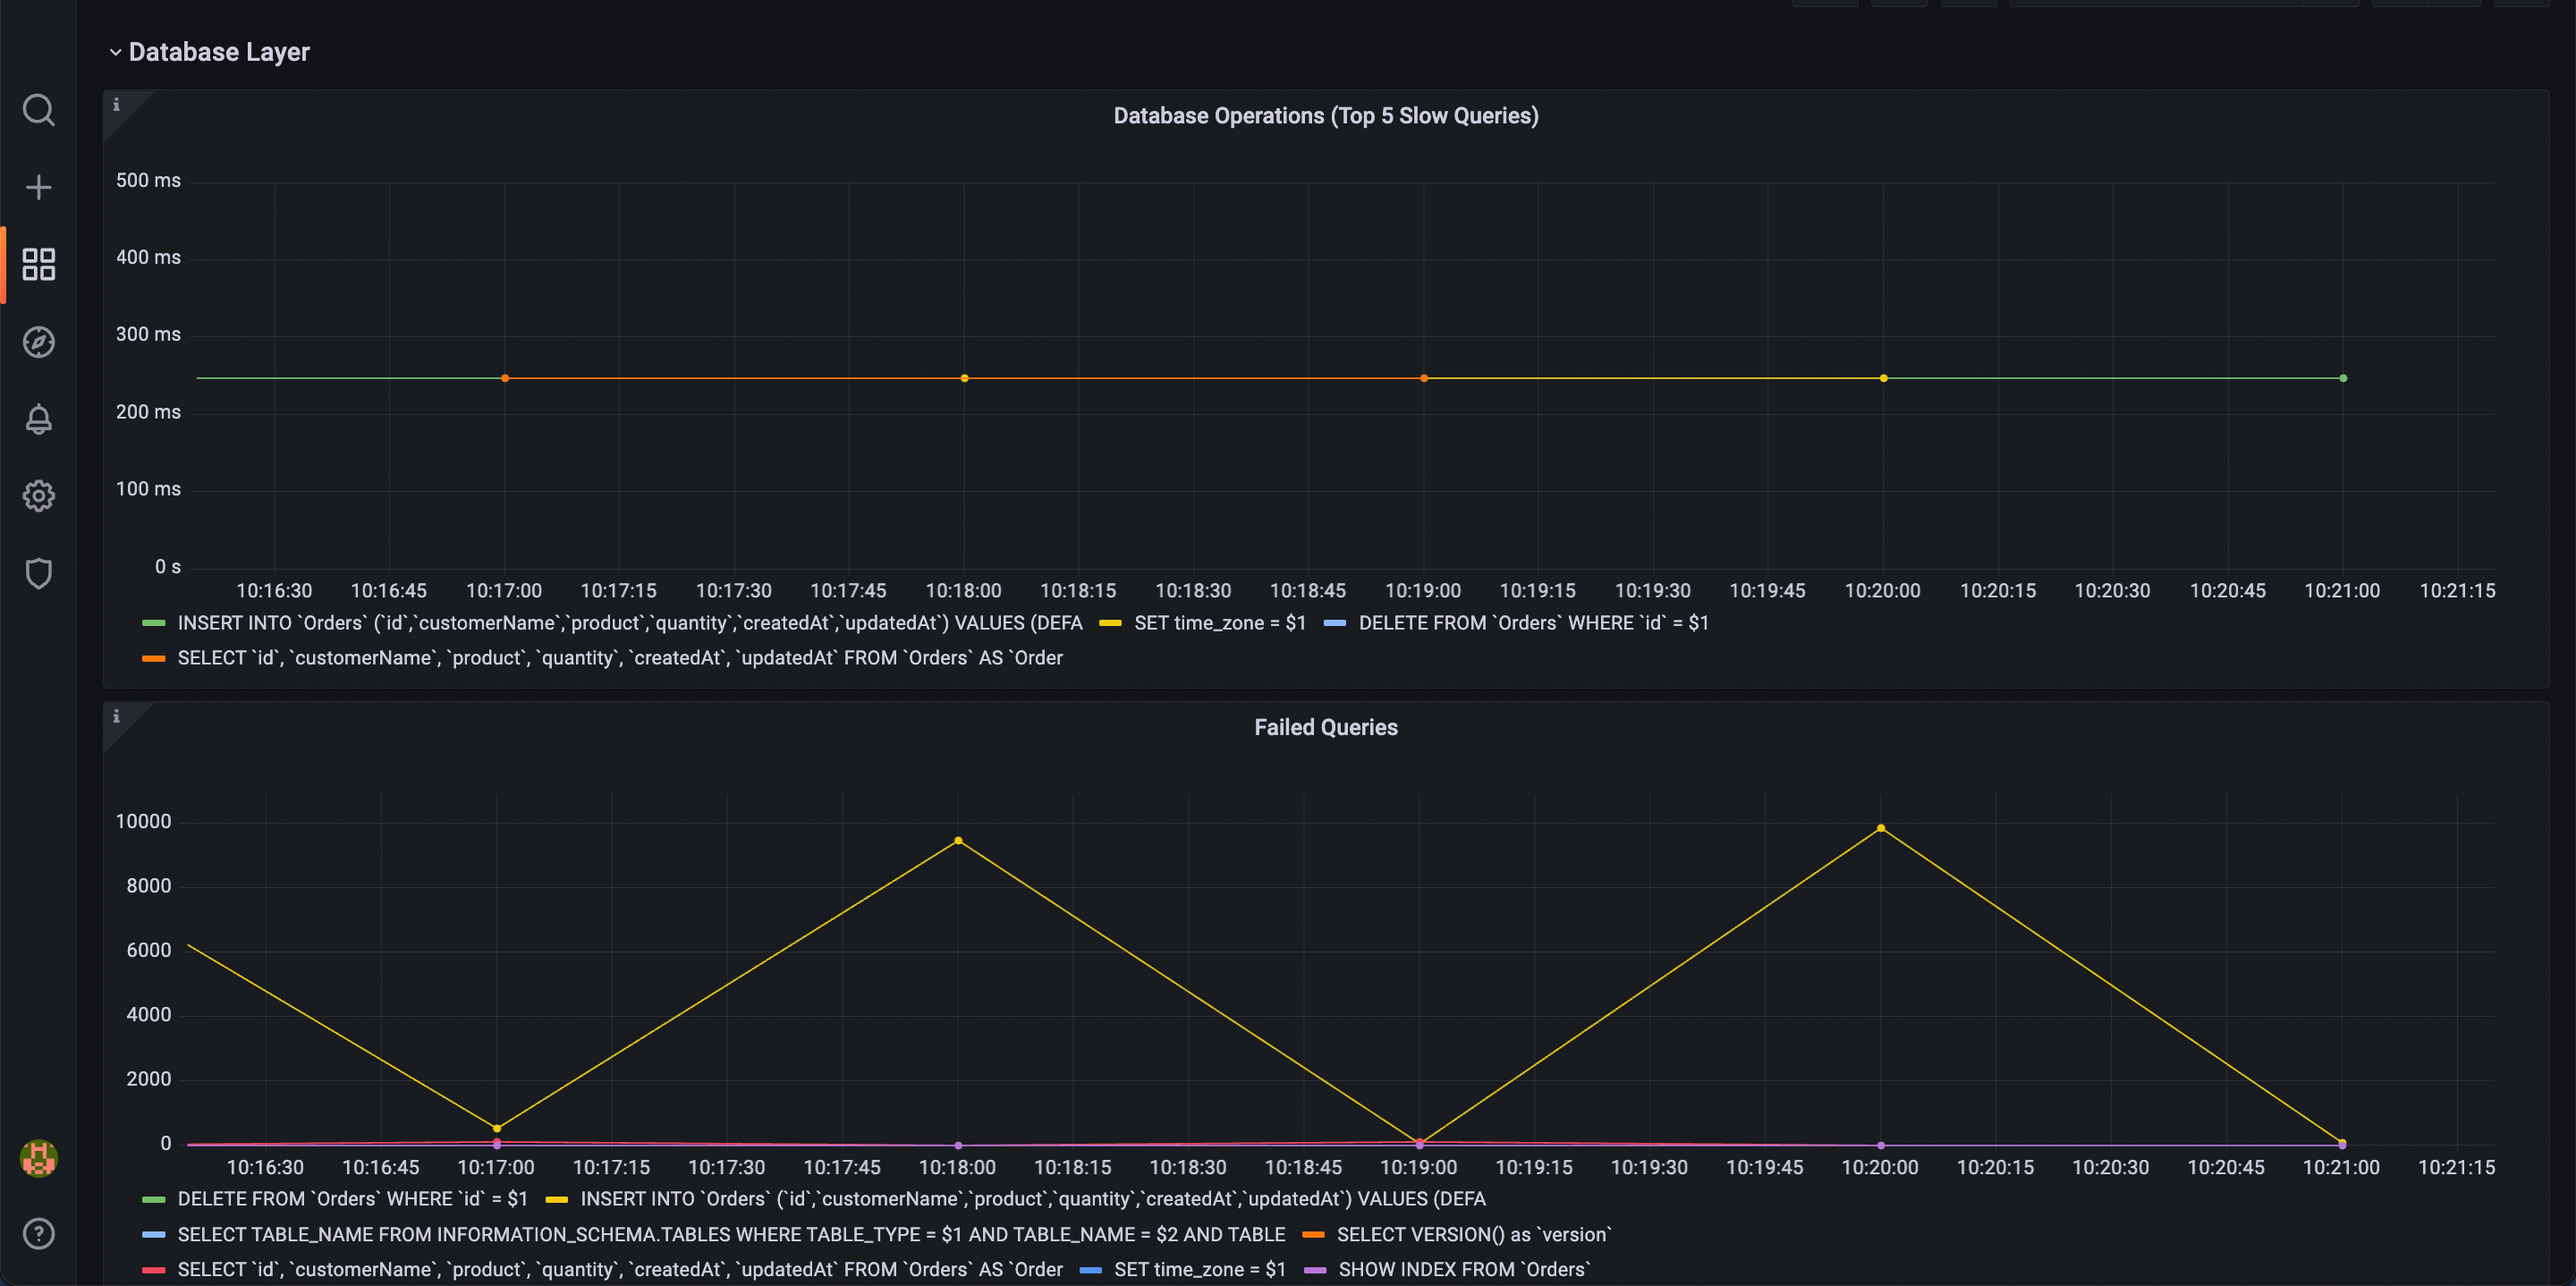
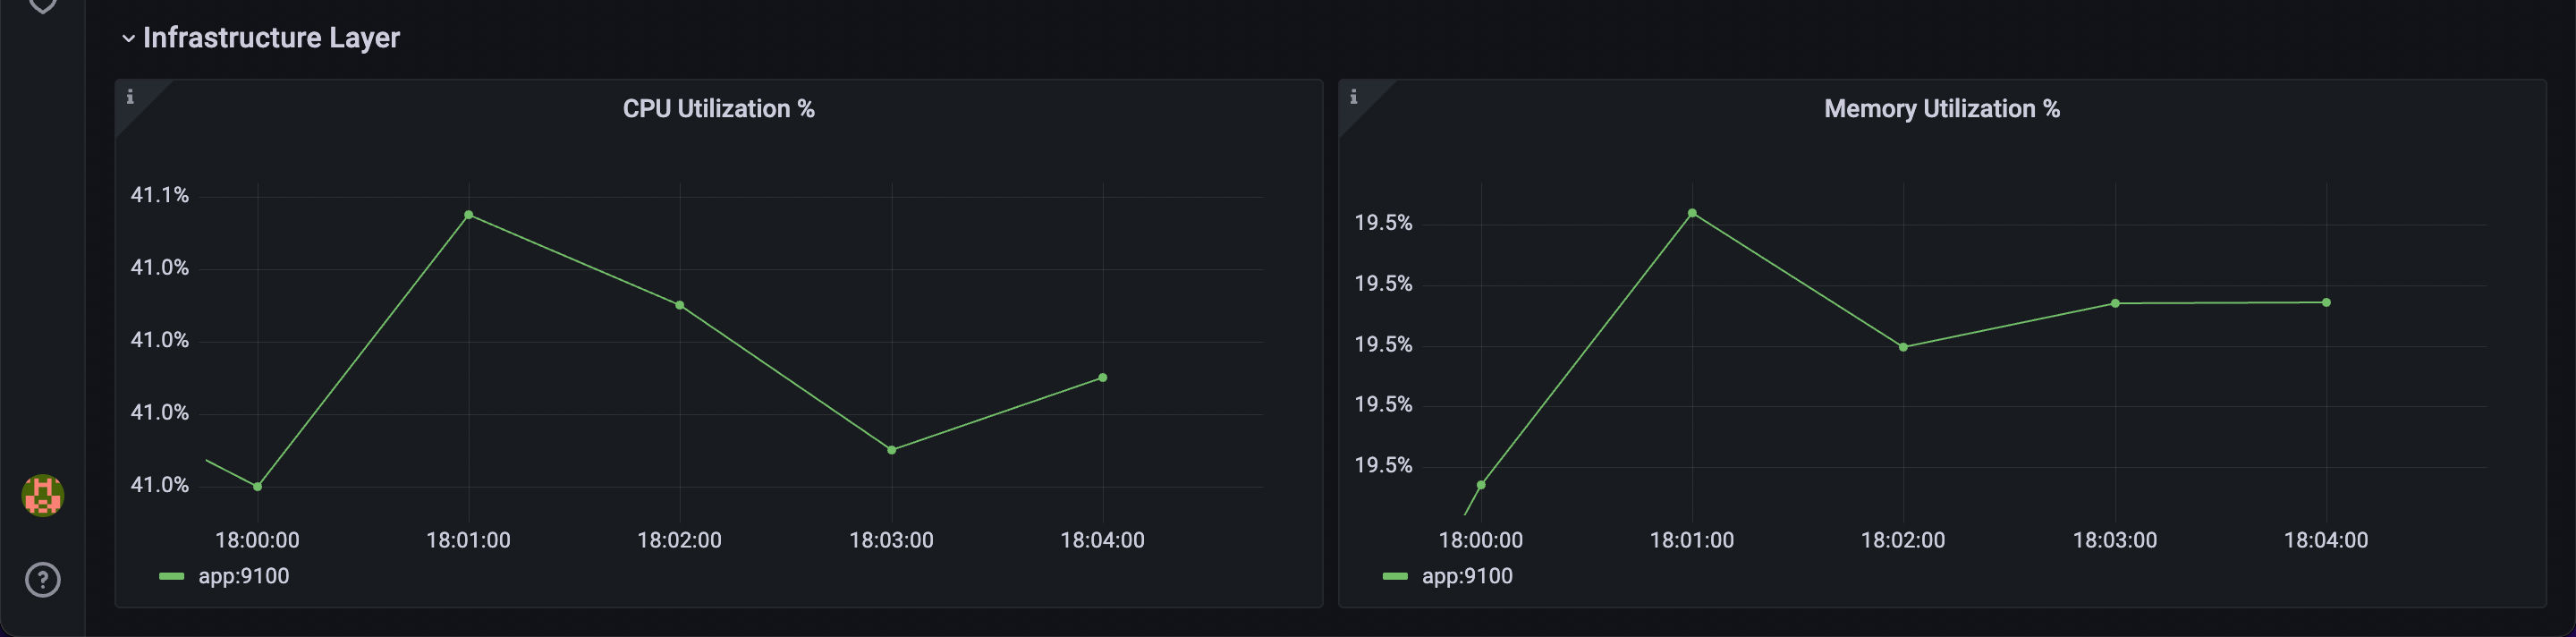
Visualization
OpenAPM collection ships with ready-to-import Grafana dashboards for applications to understand key performance indicators such as Apdex score, slow endpoints and slow database queries, among many others.
Steps to import default dashboards
- Import this dashboard into Grafana.
- Set up the data source to the one where metrics from OpenAPM are getting sent.
- Save the dashboard.