Cardinality Explorer
Identify metrics and labels impacted by cardinality.
Cardinality Explorer helps you understand how the cardinality for metrics in a Cluster is trending. This powerful feature enables you to diagnose cardinality-related challenges with your metrics.
Using Cardinality Explorer
To view an individual metric’s cardinality contribution:
-
Navigate to Control Plane → Cardinality Explore & Select the Cluster you wish to explore
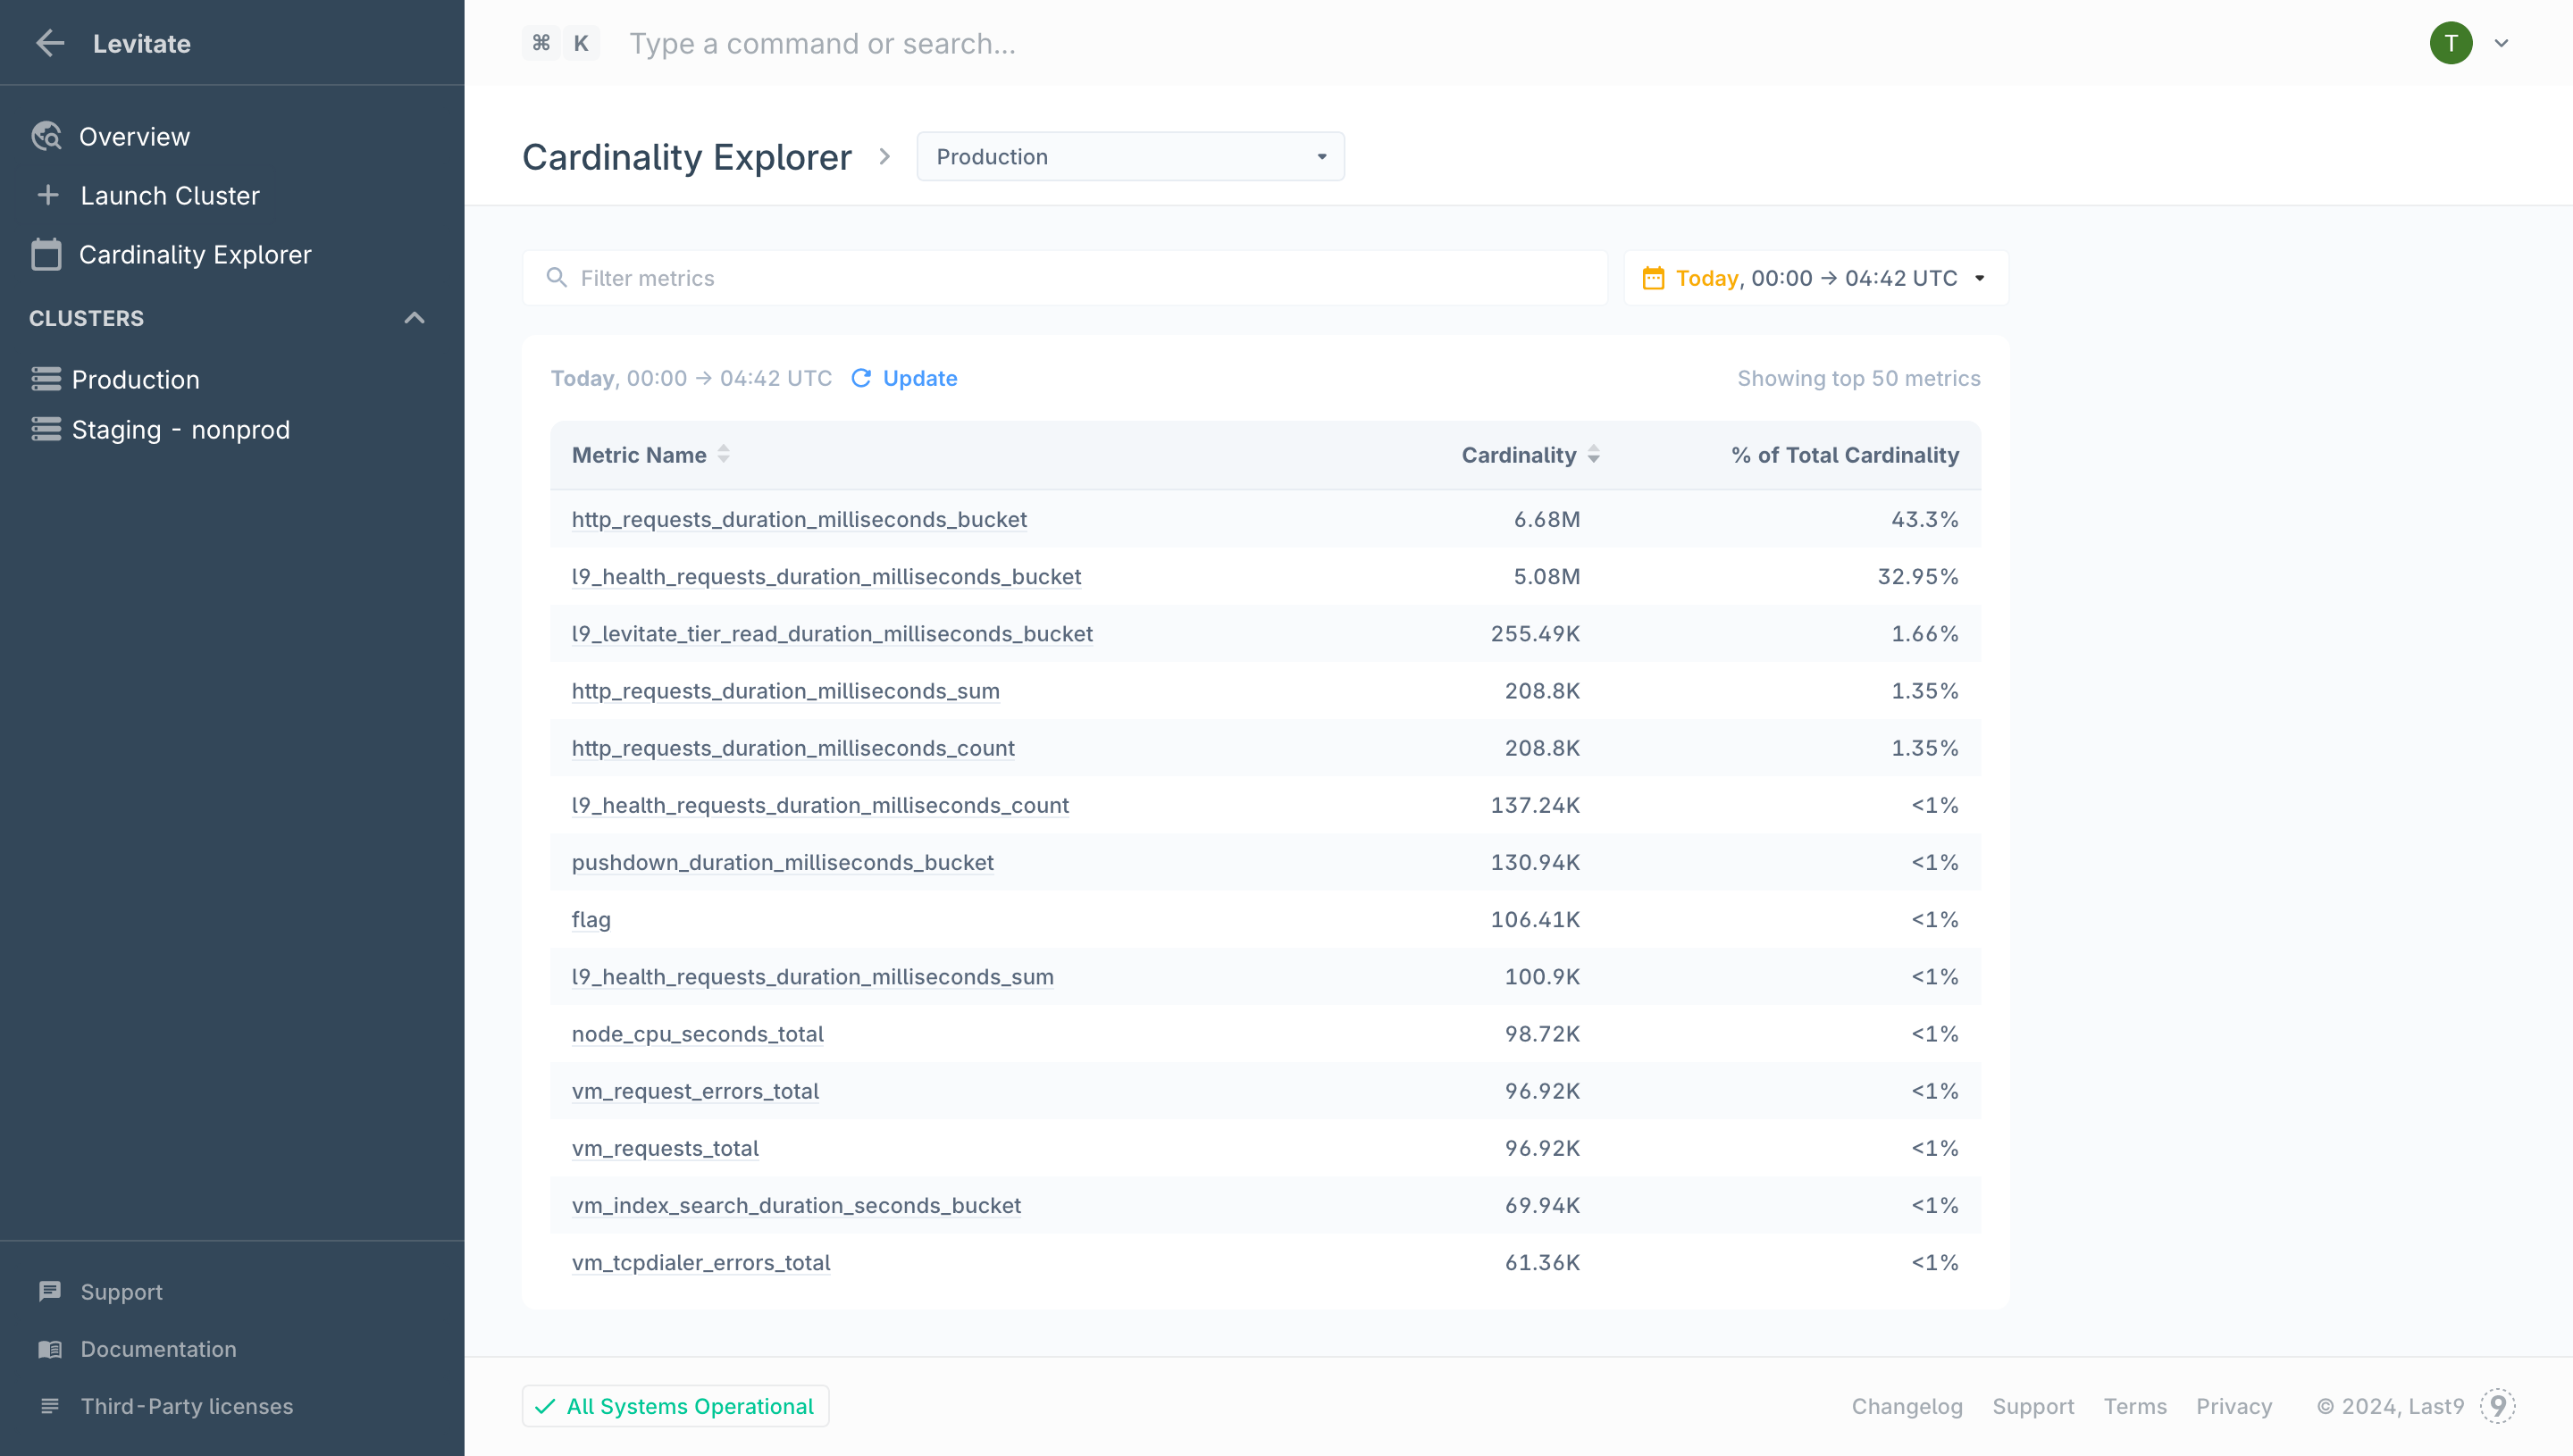 A report with all your metrics in the selected date is generated. When the current day is selected, the data shown in the table will continue to update throughout the day.
The report also highlights metrics if they have crossed or are nearing their cardinality quota limits:
- Metrics in Red have crossed their daily cardinality quota
- Metrics in Amber have crossed 80% of their daily cardinality quota
-
To view how an individual metric is contributing towards the Cluster’s cardinality, click on a metric from the table:
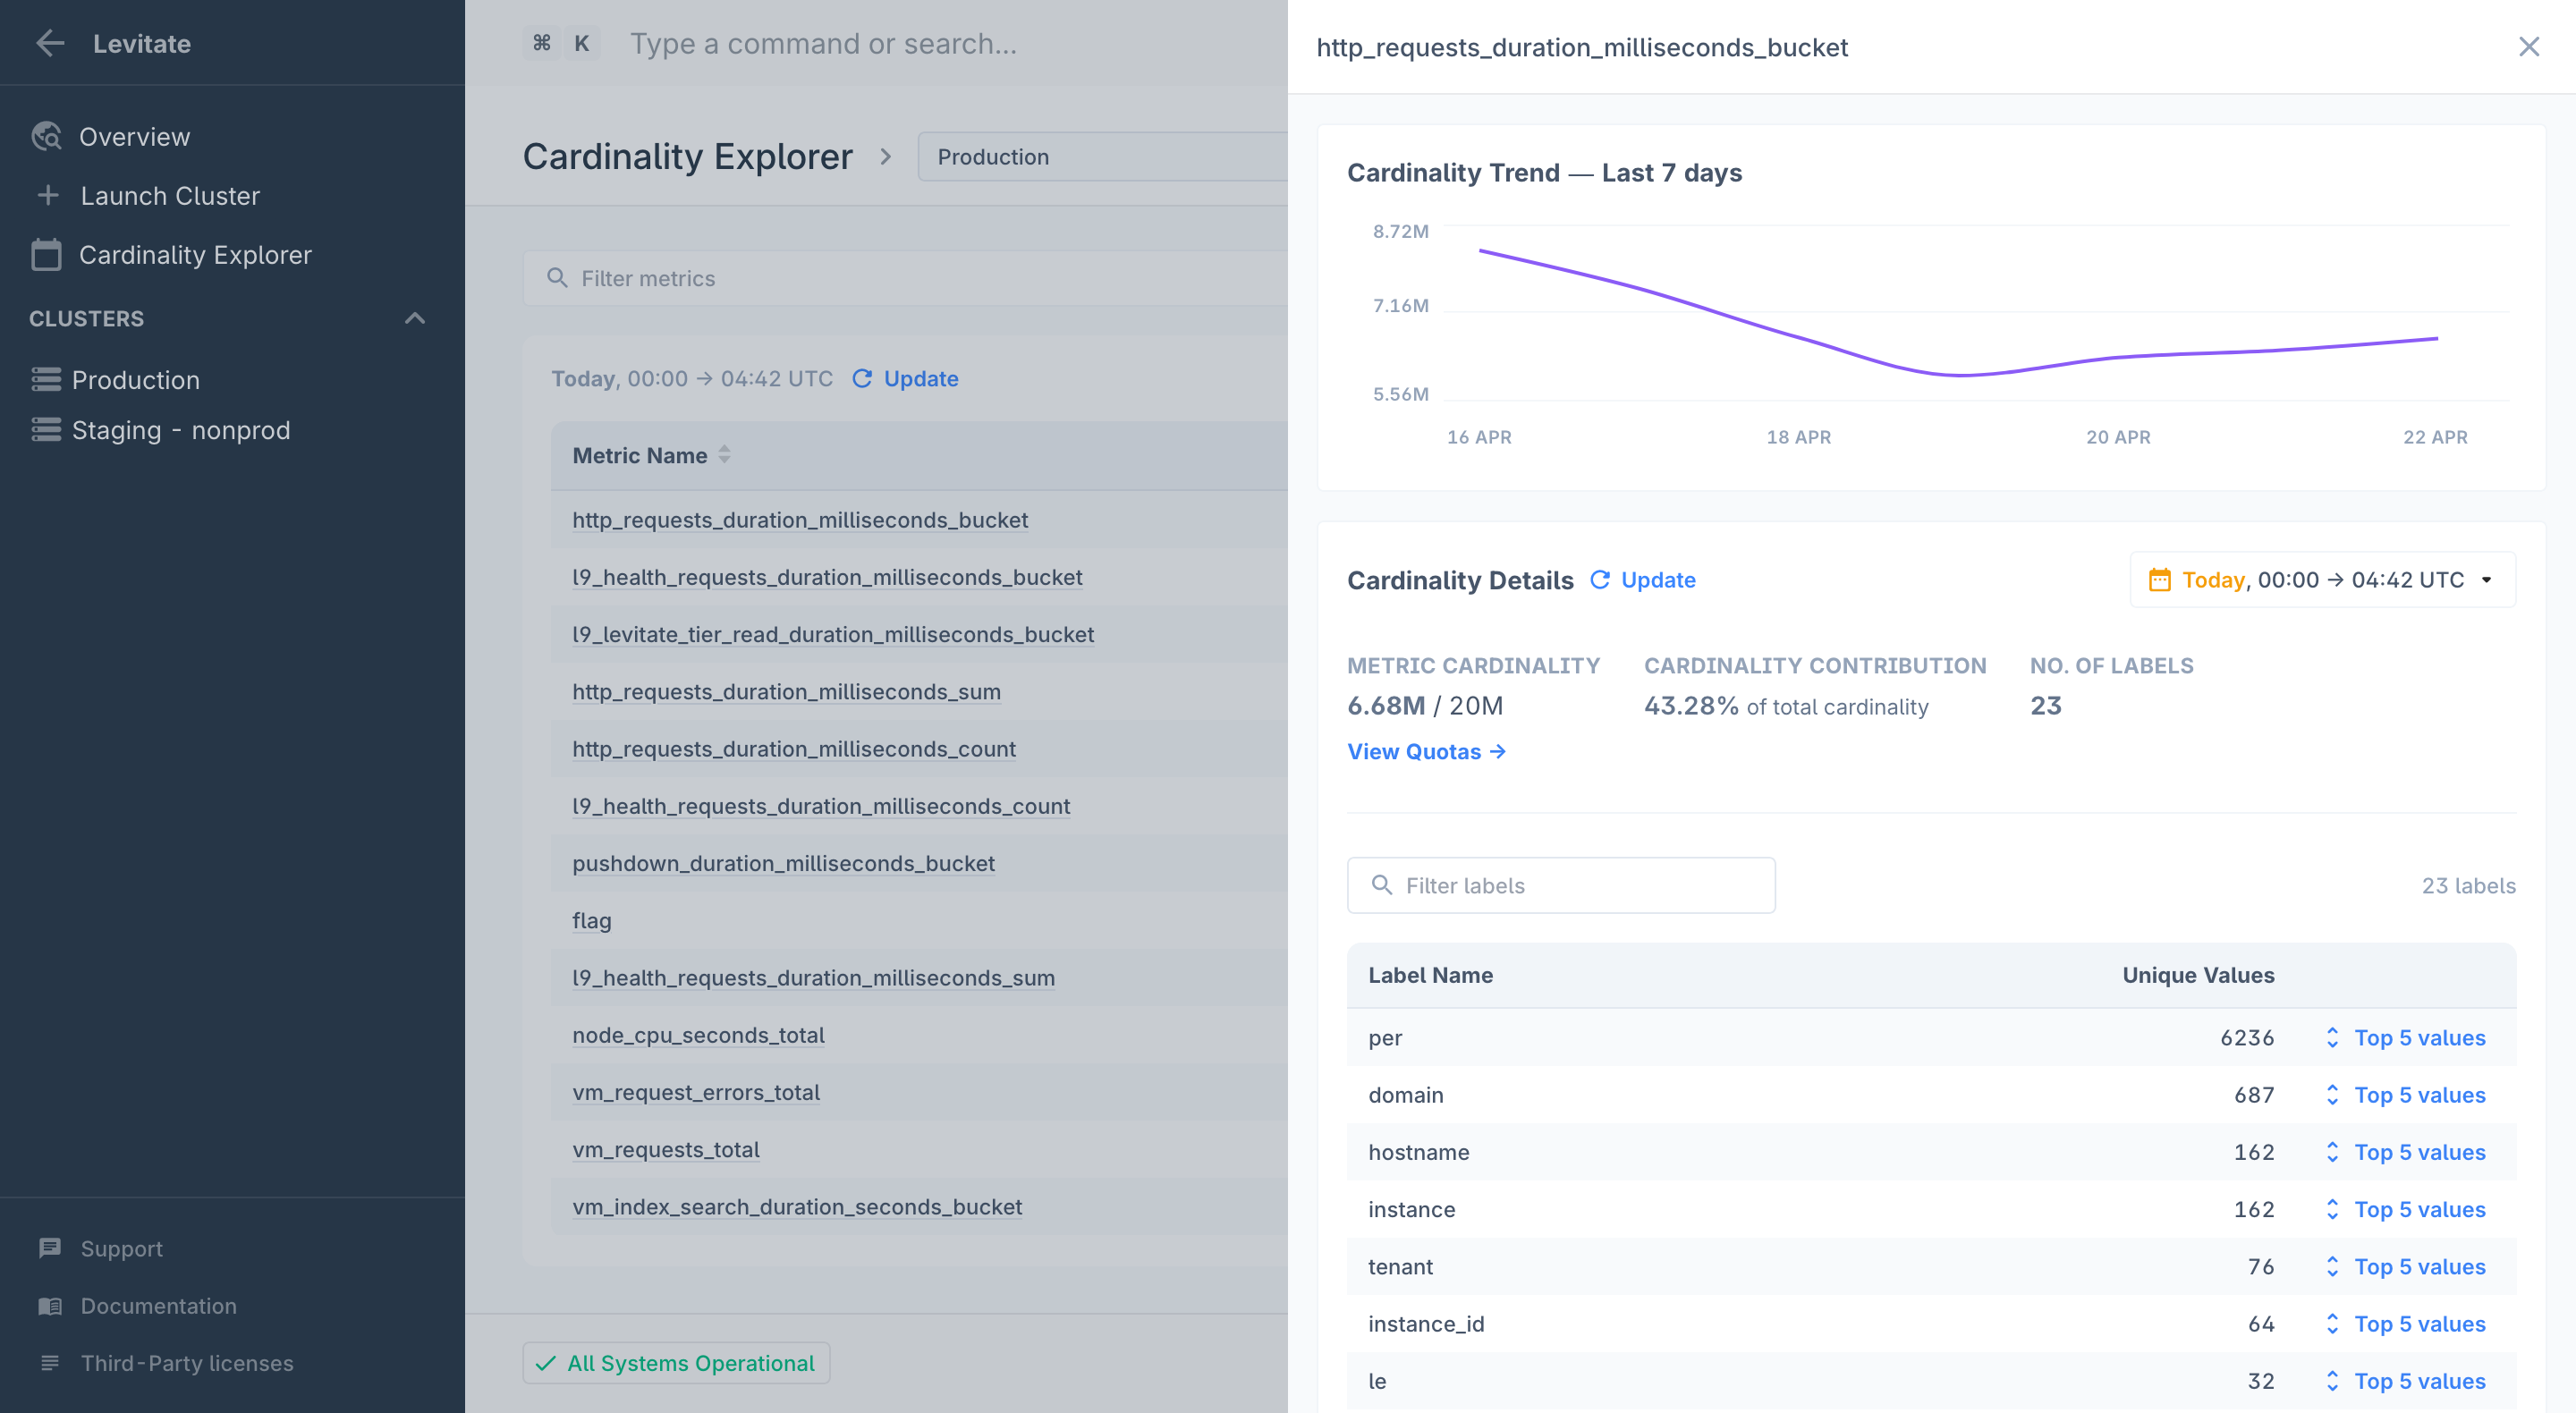 You can use this detail view to diagnose issues with the selected metric using:
- Cardinality Trend: Using this graph you can observe how the cardinality of the selected metric has trended over the last 7 days. A sudden spike or a dip may indicate unexpected changes to the cardinality of this metric
- Cardinality Details: View all the metric’s label names and their top 5 occurring label values for a selected date. Using this, you can find which labels contribute to the metric’s cardinality growth. When the current day is selected, the reported cardinality and labels shown will continue to update throughout the day
Troubleshooting
Please get in touch with us on Discord or Email if you have any questions.