Configure Grafana with Last9 as Datasource
How to configure Grafana with Last9 cluster as datasource and visualize the metrics stored in Last9
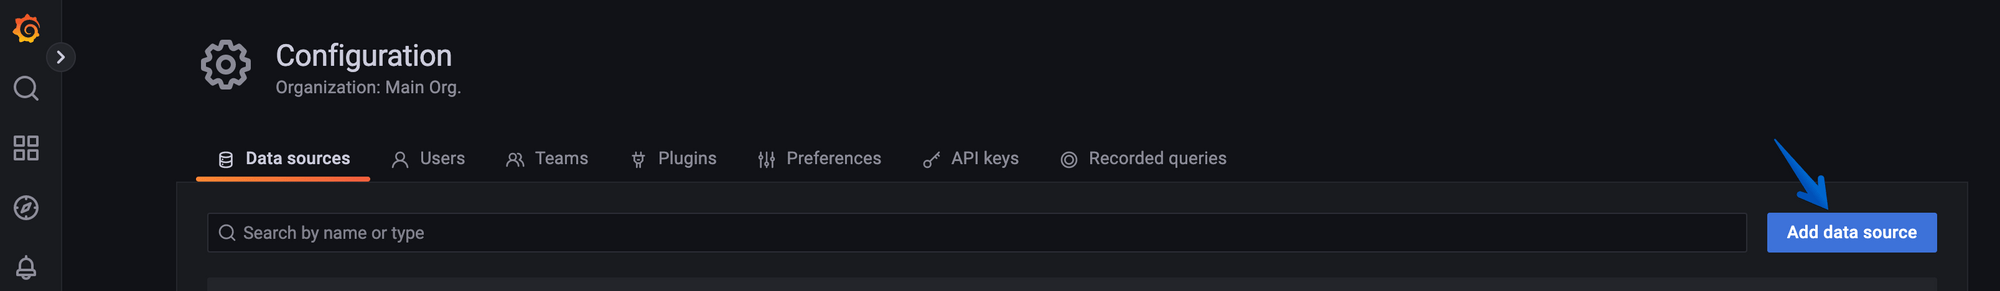
How to configure Grafana for Last9?
Create a new data source with the appropriate URL.
Each Last9 Cluster comes with a Read URL which needs to be used when creating a Data Source in Grafana.
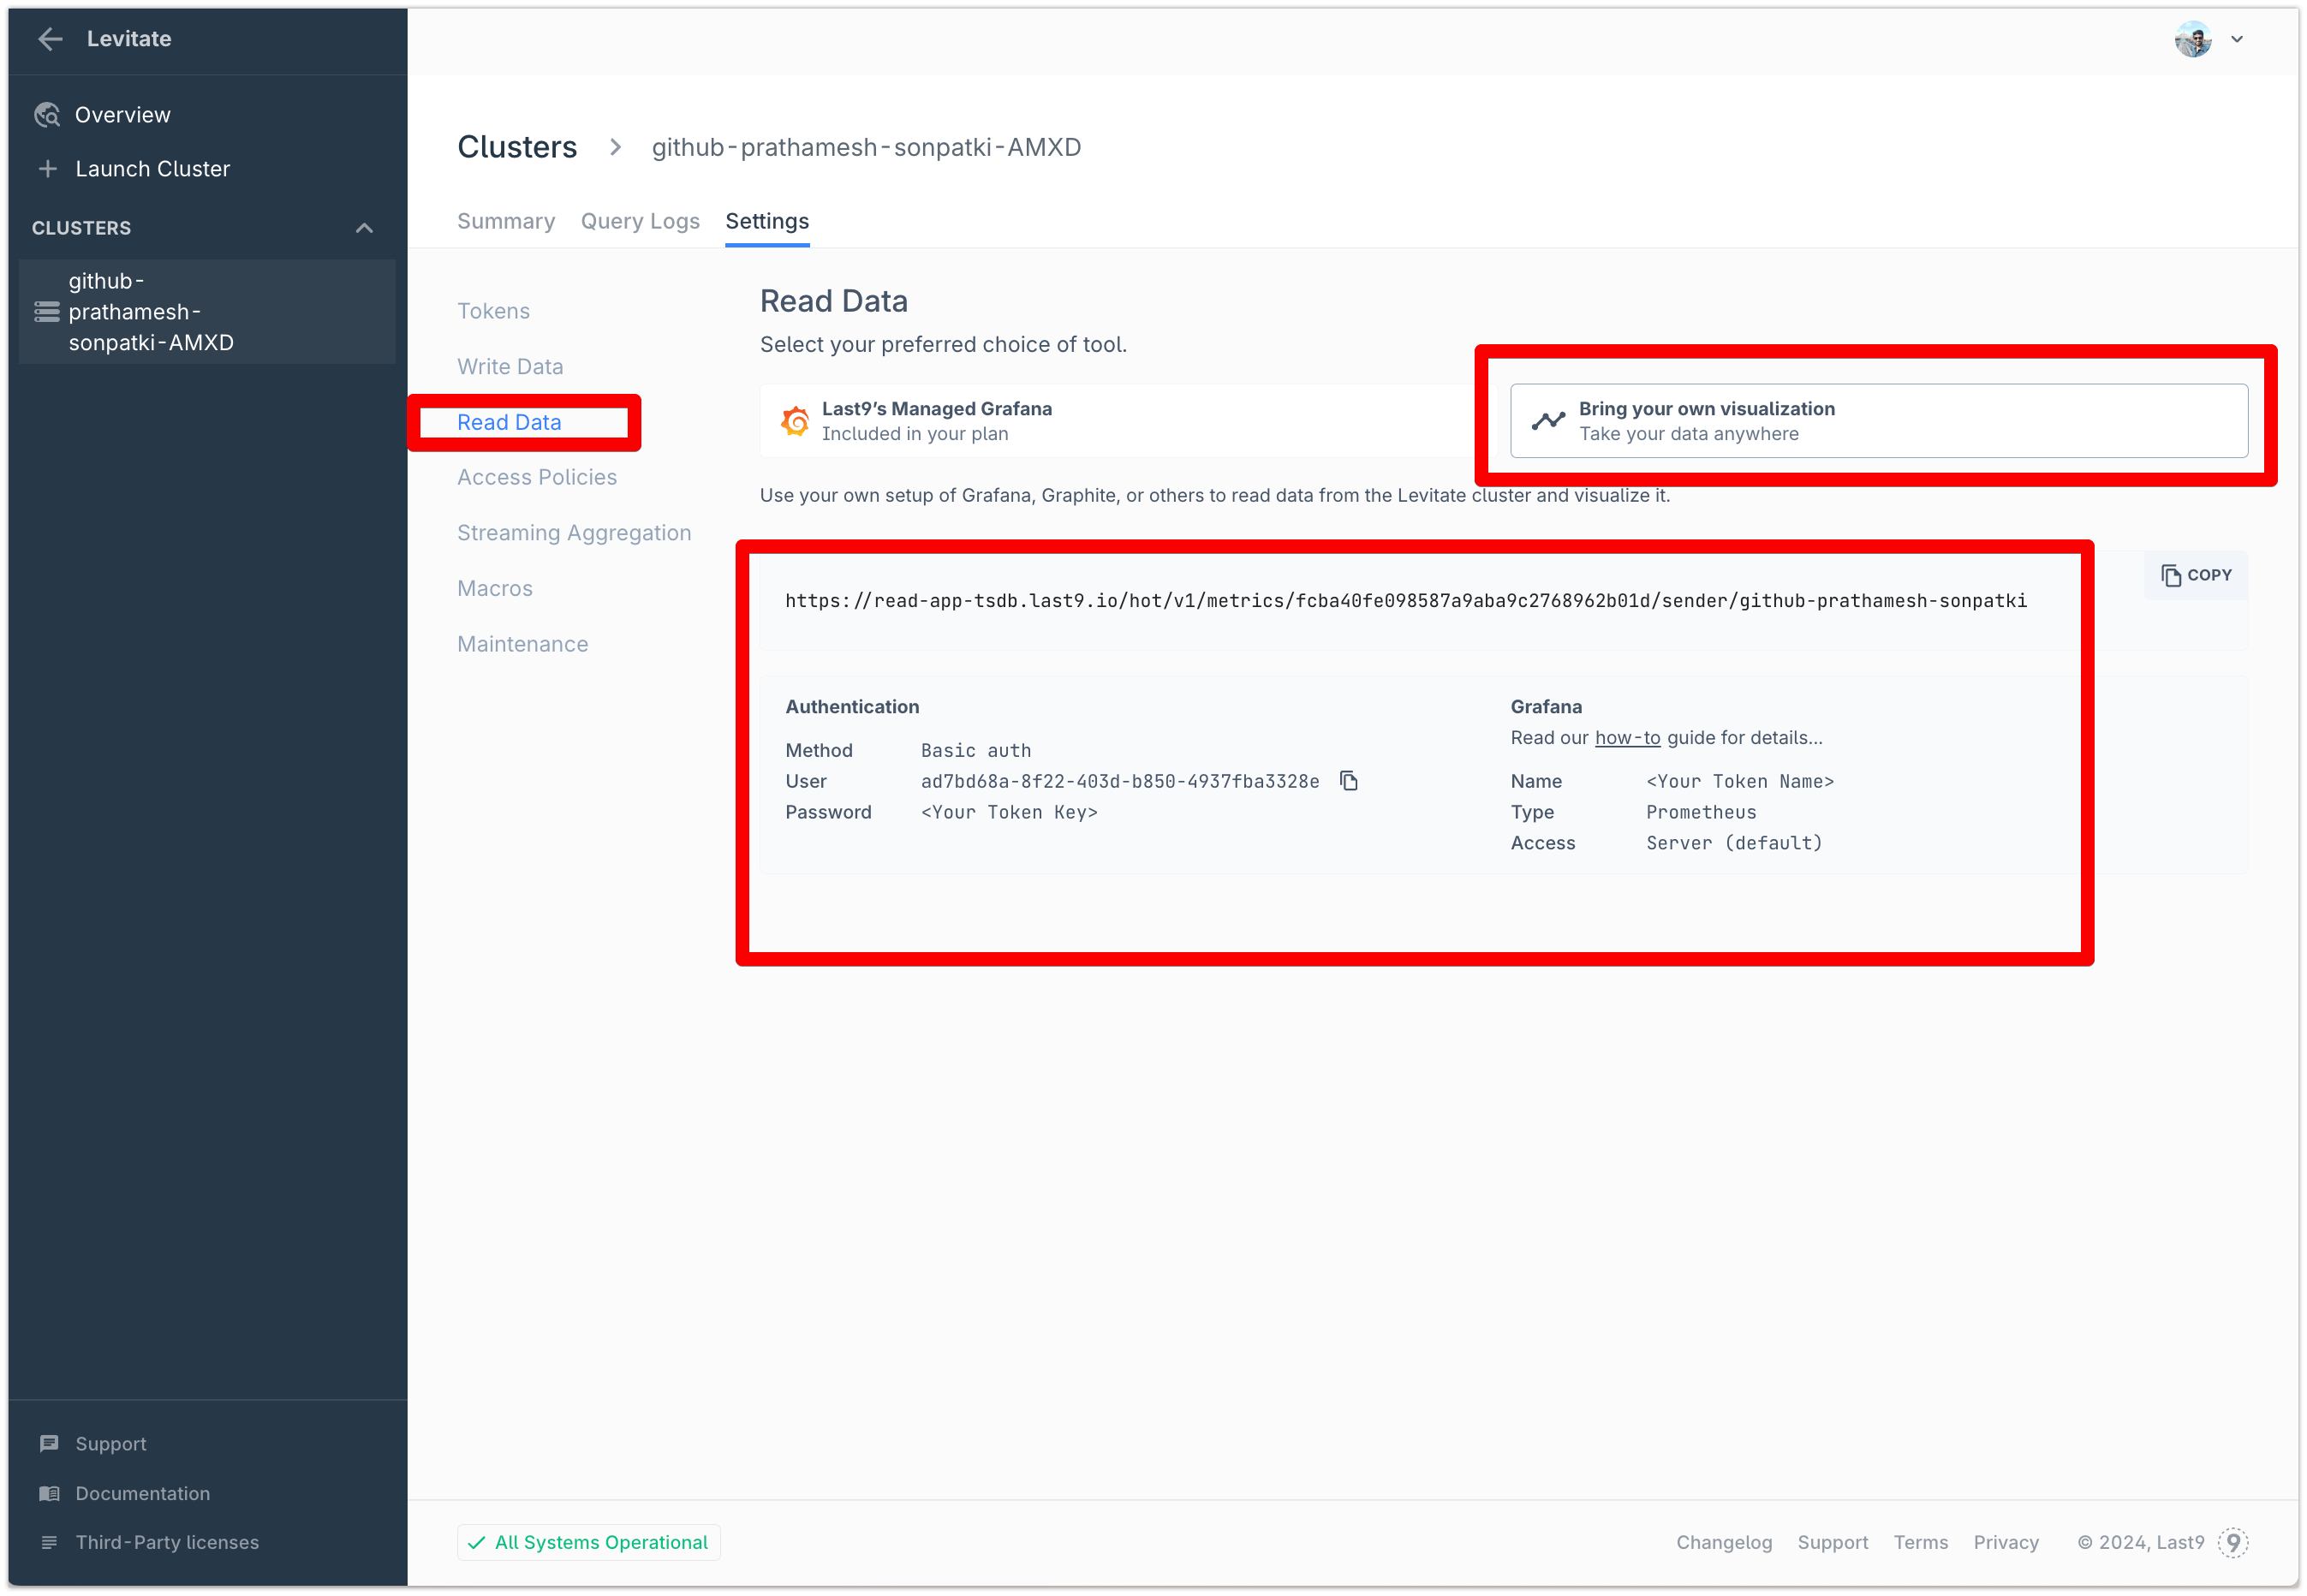
Here’s an example of creating a Data Source using the Read URL. You can grab the Read URL either:
- While creating your cluster → Read Data → Bring Your Own Visualization
- Or, by going to the Last9 Cluster → Settings → Read Data → Bring Your Own Visualization
Last9 Read URL mandates authenticated access. Create a Read Token for your
cluster and use it as password. Use the cluster id as user.
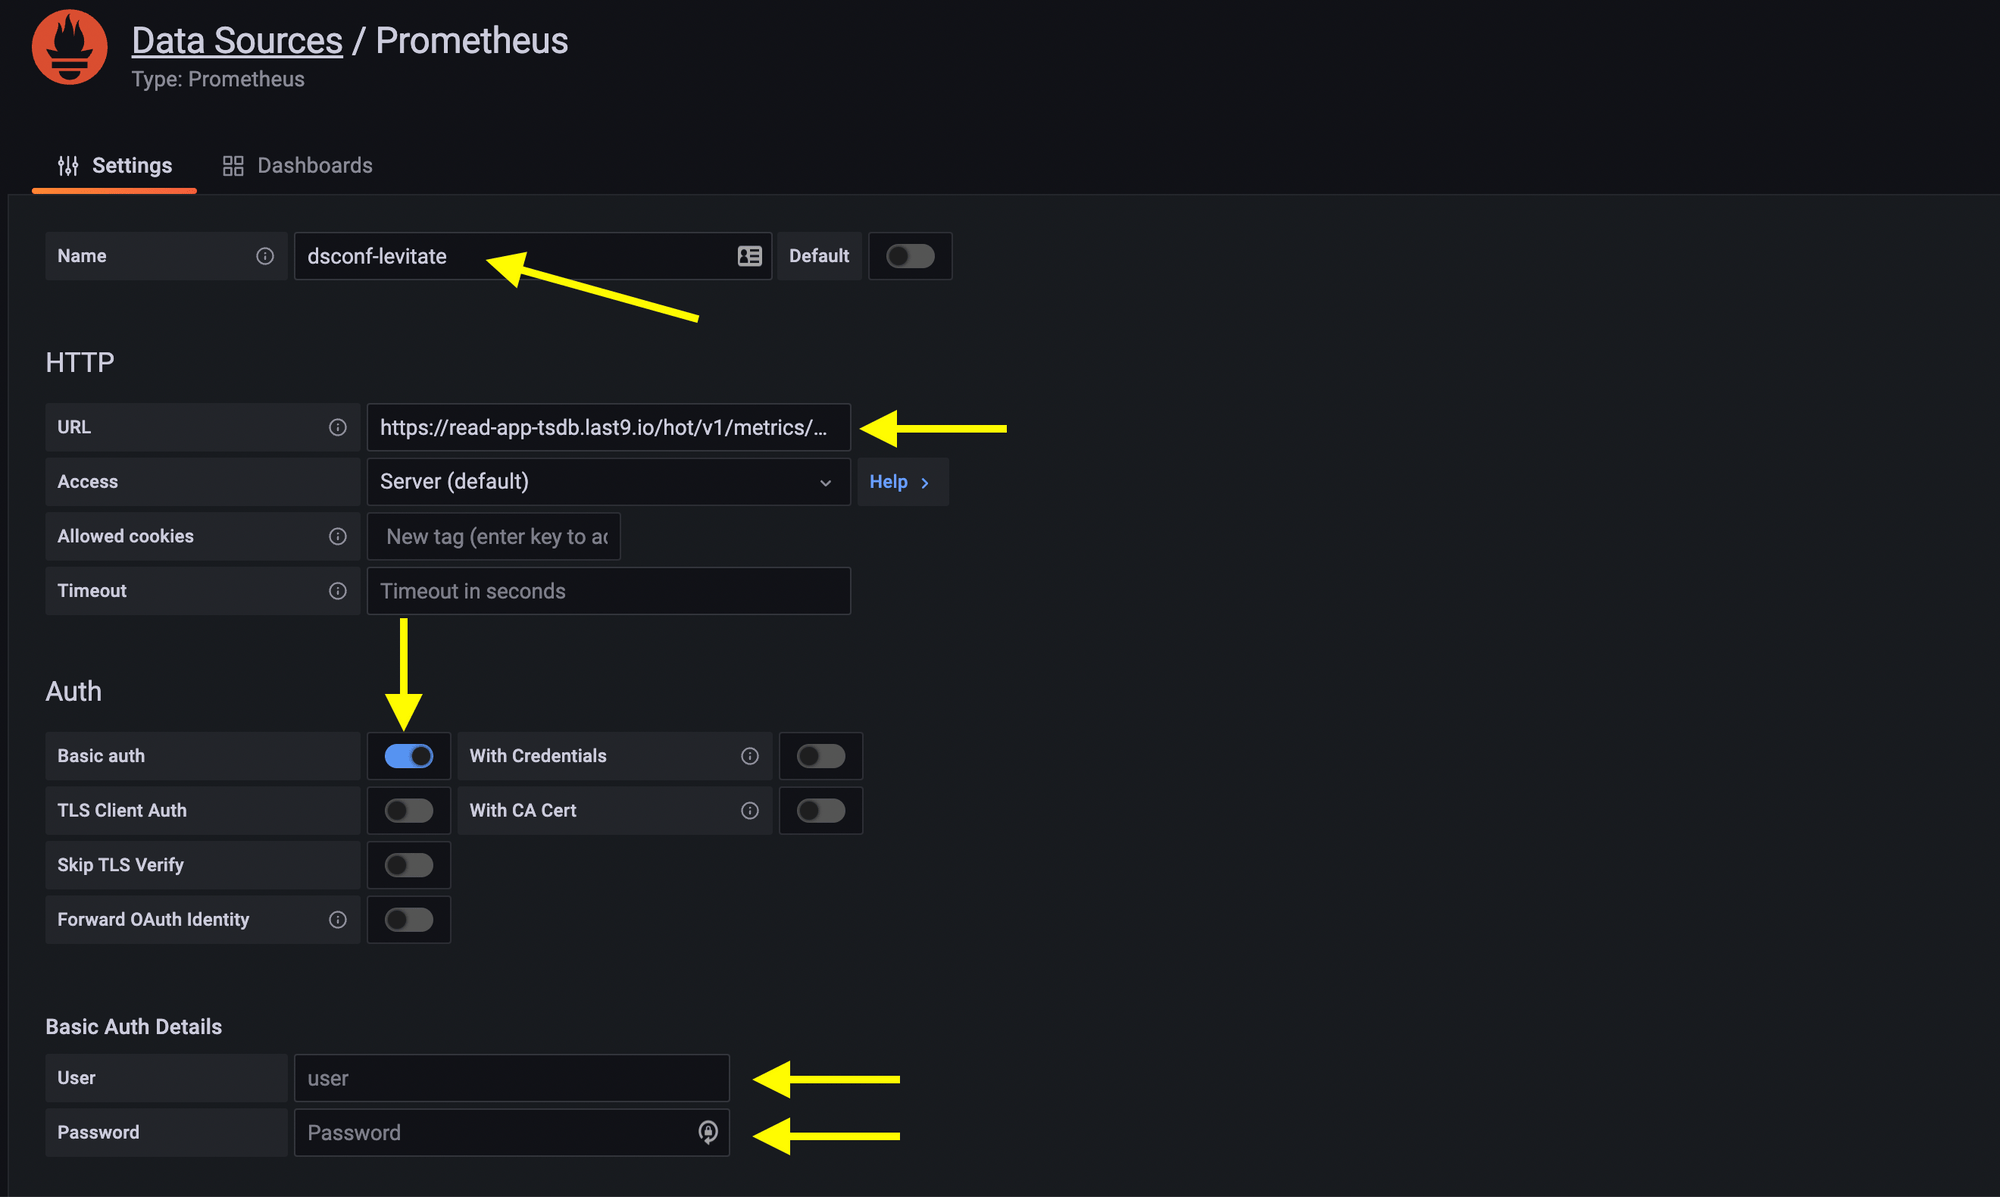
Add the user and password in the Basic Auth Details
section while creating data source in Grafana.
Make sure that the status of the data source appears as all ✅.
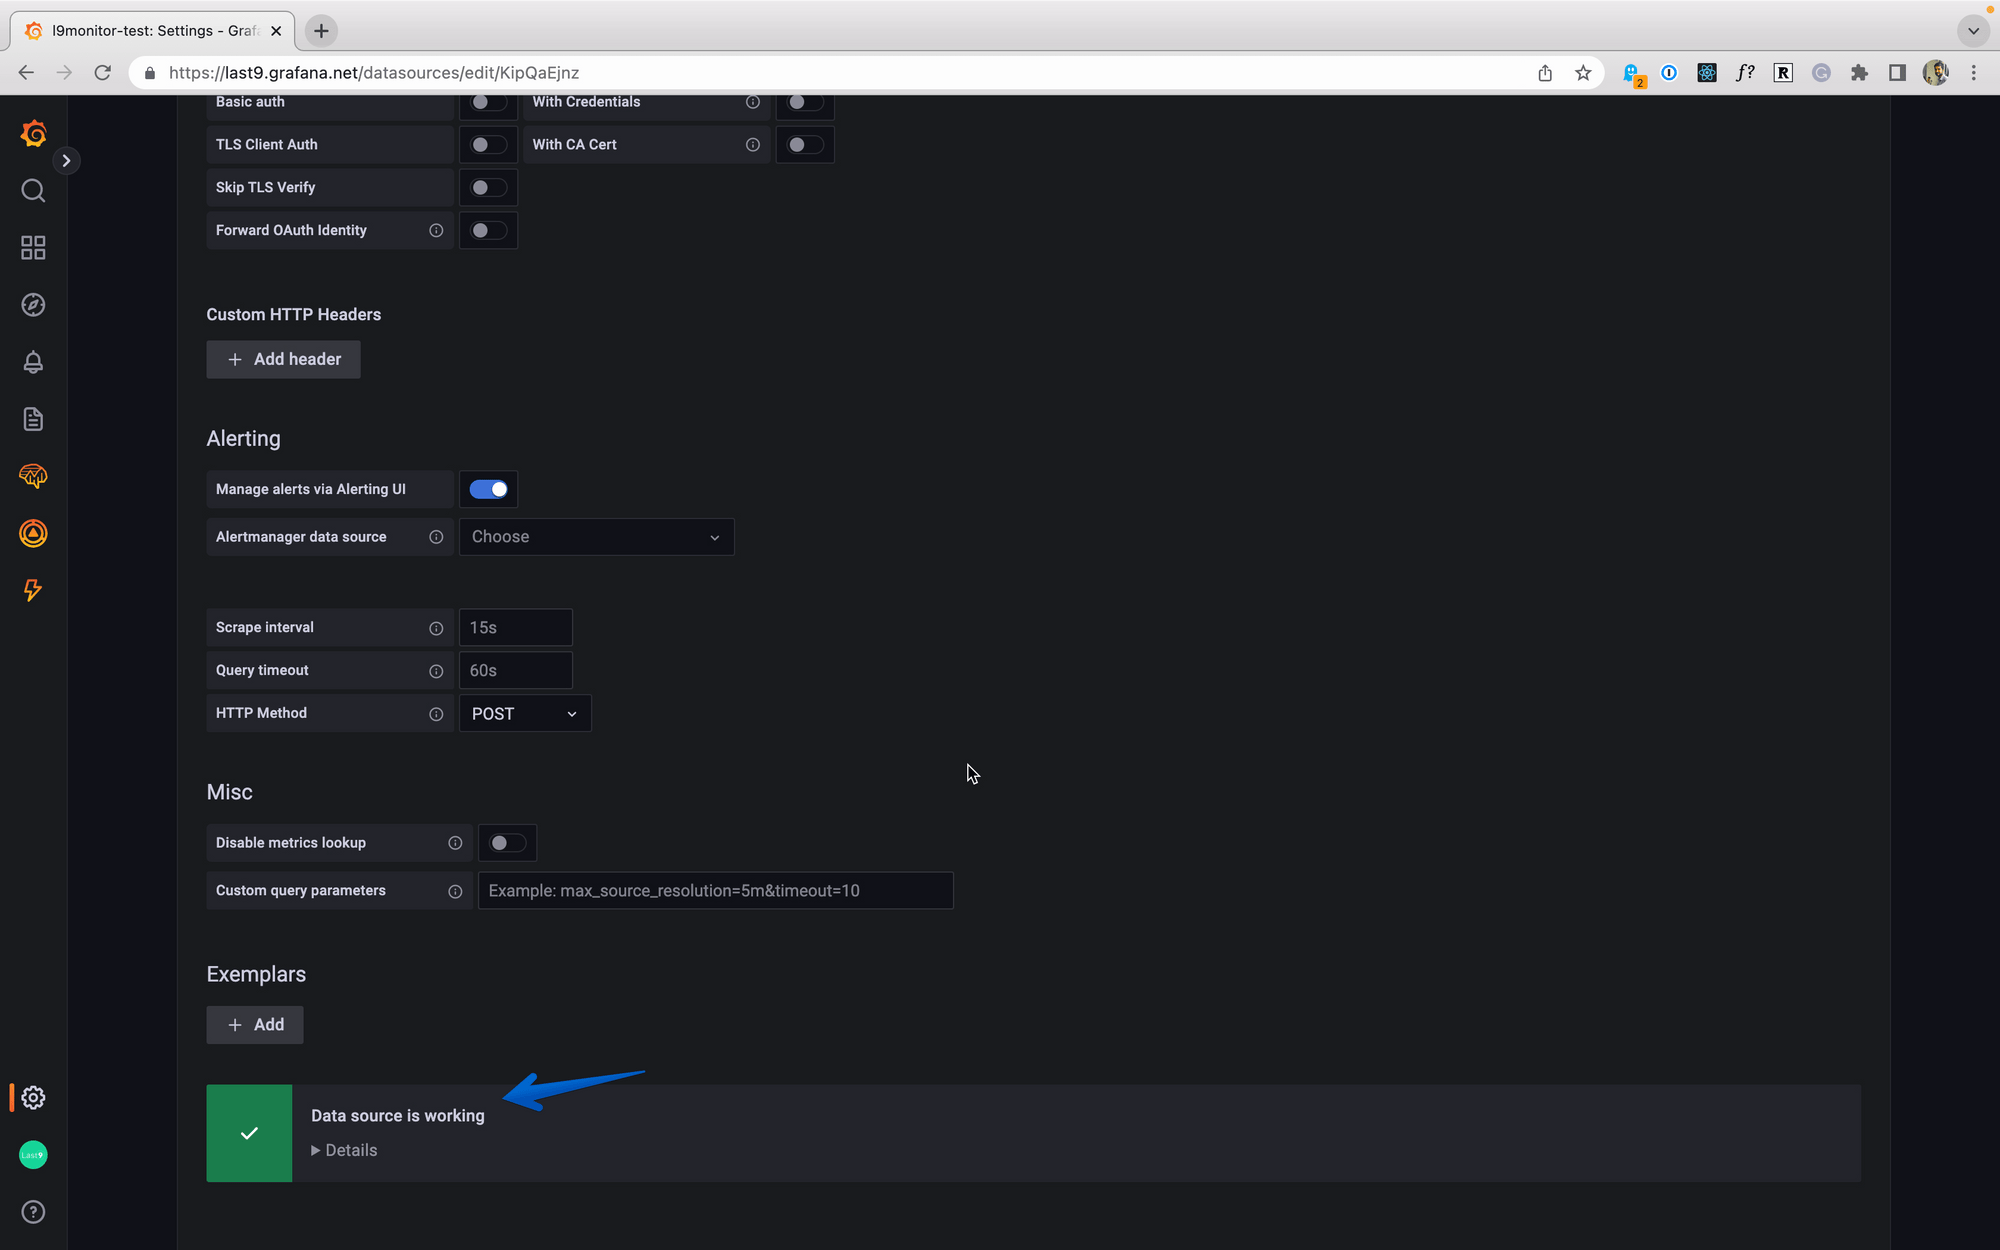
After this, try exploring data or create a new dashboard in Grafana based on metrics in Last9.
Troubleshooting
Please get in touch with us on Discord or Email if you have any questions.