What is Last9?
Everything you need to know about Last9's managed PromQL-compatible Time Series Data Warehouse.
What is Last9?
Last9 is an OpenTelemetry and Prometheus Compatible Managed Time Series Data Warehouse.
We built Last9 to give engineering teams a cost-effective tool to monitor large, complex systems. Engineering hours are not spent monitoring your monitor, i.e., managing TSDB availability, scaling, replication, and multiple instances.
- Solves High Cardinality: Last9 is built to handle massive data scales and can run queries at high cardinality. Above all, it gives you real-time insights into what metrics are unused.
- Pay for what you use, reduce costs: Last9 reduces storage costs by up to 50% compared to similar TSDBs. This exceeds the engineering time and overheads spent maintaining internal infrastructure. With Last9's data retention policies & tiered storage, you pay for the metrics you use—scale without having to tune the configuration & having to run a whole setup for data scaling.
- Increase engineering productivity: Last9 is fully managed—no need to worry about adding more machines, managing replication, or multiple Prometheus instances. Just change the remote-write endpoint of your one or many TSDBs. A simple UI manages it all.
With Last9, you can resolve incidents faster with decreased querying times and allow engineering to focus on building the product.
Last9 vs. other Managed Prometheus offerings
Last9 is built for high query performance, availability, and low latency writing. Last9 automatically scales your data ingestion, query speed, and concurrency needs.
Last9’s write availability SLA is 99.9%, with no work needed by your team!
That means your Prometheus agents can be lightweight transmitters. Bye Bye storage concerns and no data loss. 👋
Last9’s standard read availability SLA is 99.5%, giving your team confidence that your monitoring database won’t leave your team blind during an incident.
Last9's SLAs can be tweaked depending on your business needs. Talk to us on hi@last9.io to know more details.
Last9 Service Level Agreements
| Operation Type | Availability |
|---|---|
| Read from any tier | 99.5 |
| Write | 99.9 |
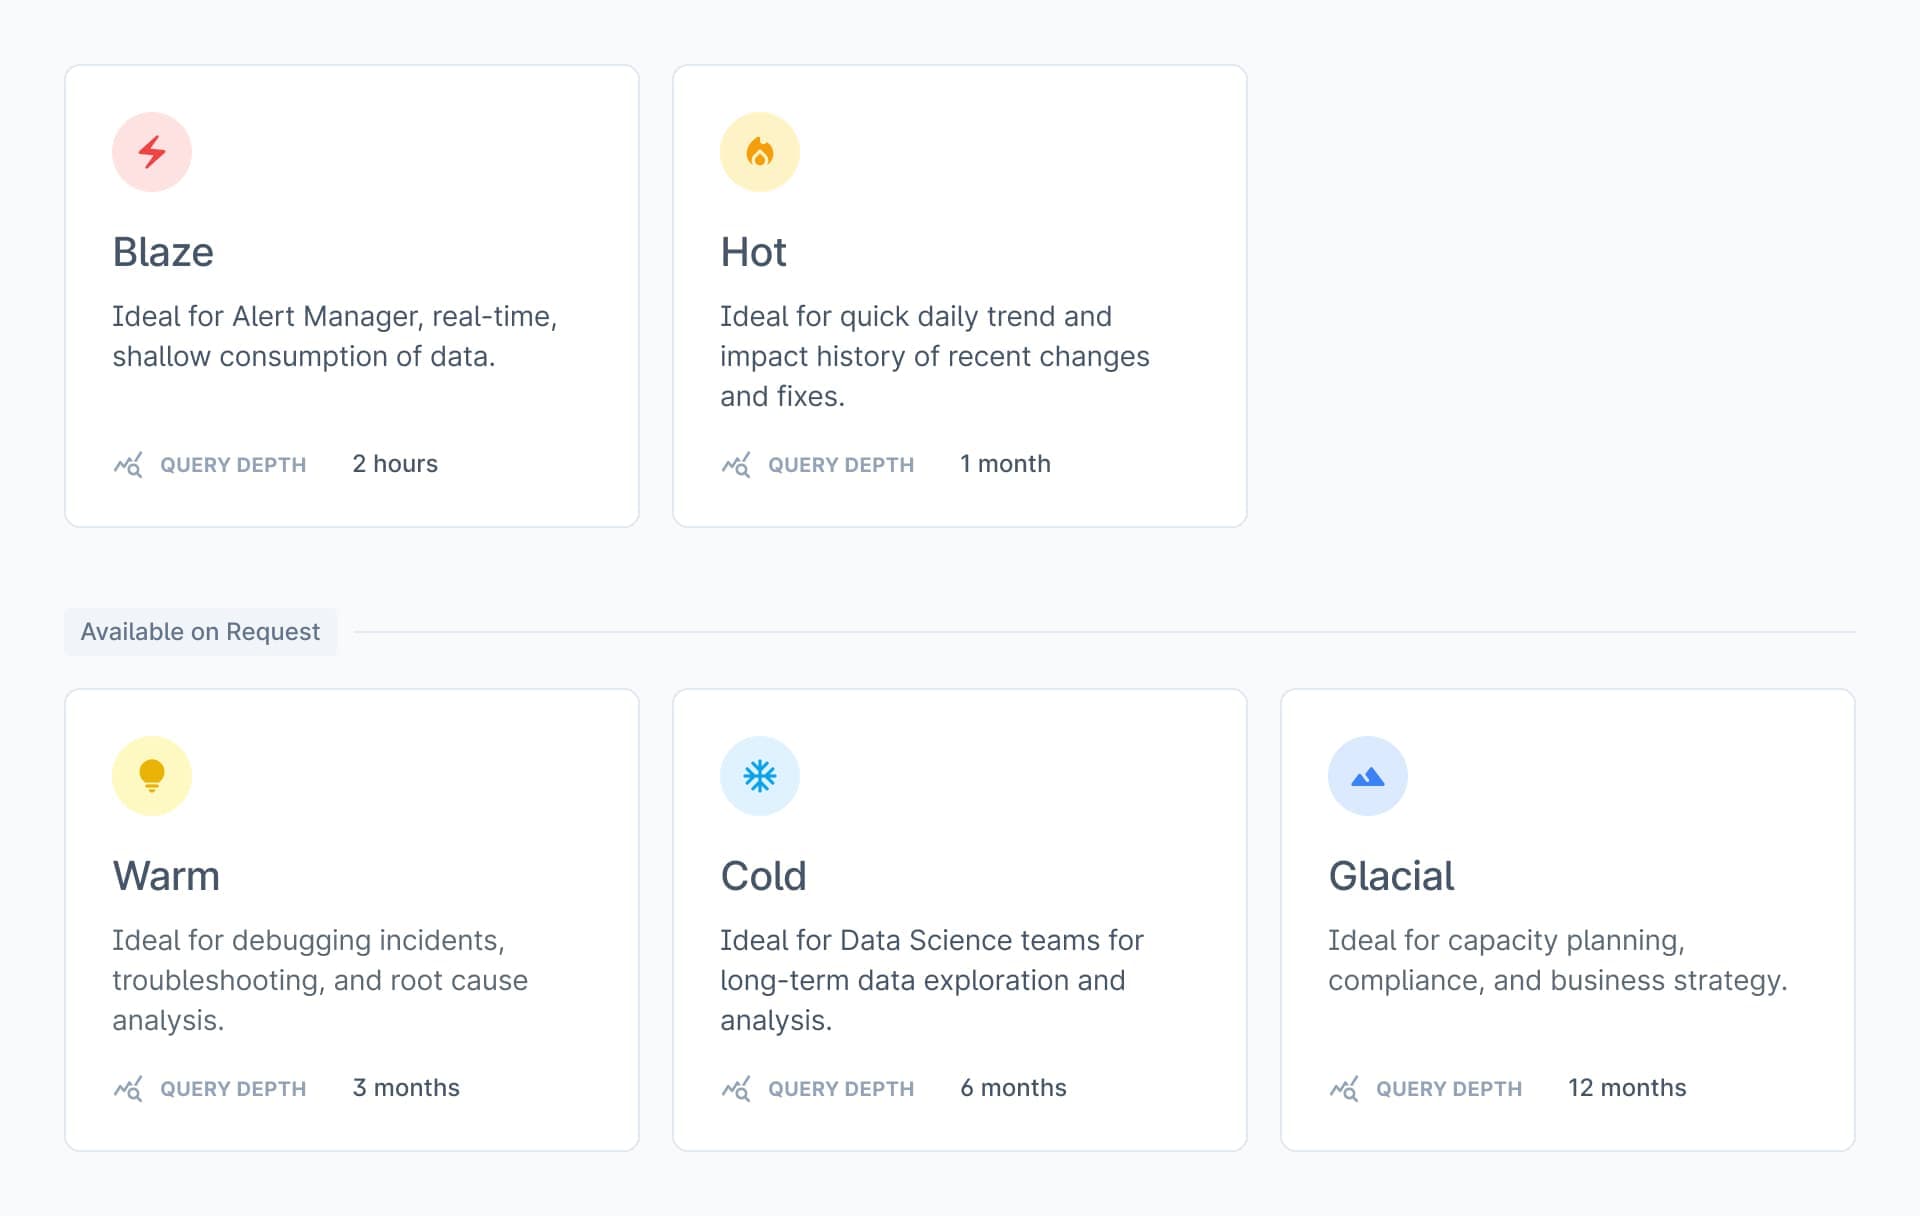
Tiers
Inspired by principles of Data Warehousing, where Data Tiering is a common phenomenon, Last9 introduces tiers for Time Series storage.
Teams only emit metrics to a single write endpoint from an Integration perspective, and data reaches each tier. All Tiers have all the fresh data, but their data retention varies. Each tier functions as a completely independent Time Series Data Warehouse but serves different concurrencies, query latency, and depths.
To understand the power of tiers, imagine the current situation where all the metrics, used or unused, are saved in the database. Say there is an auto-refreshing dashboard panel that greedily aggregates six months of payment failures saved per transaction and renders it on a histogram chart. Imagine five such dashboards, refreshing every 15 seconds. This is enough to bring an 8-core, 32GB RAM database to its knees. During this period, the ingestion, as well as critical alerting, gets impacted.
This lack of control results in constant horizontal scaling of the database and that’s time and money spent on metrics that are not even used.
You don’t just pay extra for what you don’t use; you pay extra because of what you don’t use.
Last9 can segregate data into Virtual clusters, or Tiers, with distinct access control parameters like:
- Retention Limit: Limit the available data in the Tier. i.e., x months/days/hours.
- Concurrency Control: Limit the active number of queries the Tier can handle simultaneously. This is the most trustworthy indicator of Performance.
- Range Control: Limit the number of days of data allowed to be looked up in a single query. It directly impacts the number of data points or series loaded into the memory.
Policies and Governance
Last9 can segregate data into Virtual clusters, or Tiers, with distinct access control parameters like:
- Retention Limit: Limit the available data in the Tier. i.e., x months/days/hours.
- Concurrency Control: Limit the active number of queries the Tier can handle simultaneously. This is the most trustworthy indicator of Performance.
- Range Control: Limit the number of days of data allowed to be looked up in a single query. It directly impacts the number of data points or series loaded into the memory.
Last9 has powerful features to identify time series your team isn’t using and trim data according to policies you create. Organizations can also create Policies and have better data Governance.
Policies are classified as Access Policies and Data Policies.
Access Policy
Access Policies control how Tiers are engaged based on Access Methods.
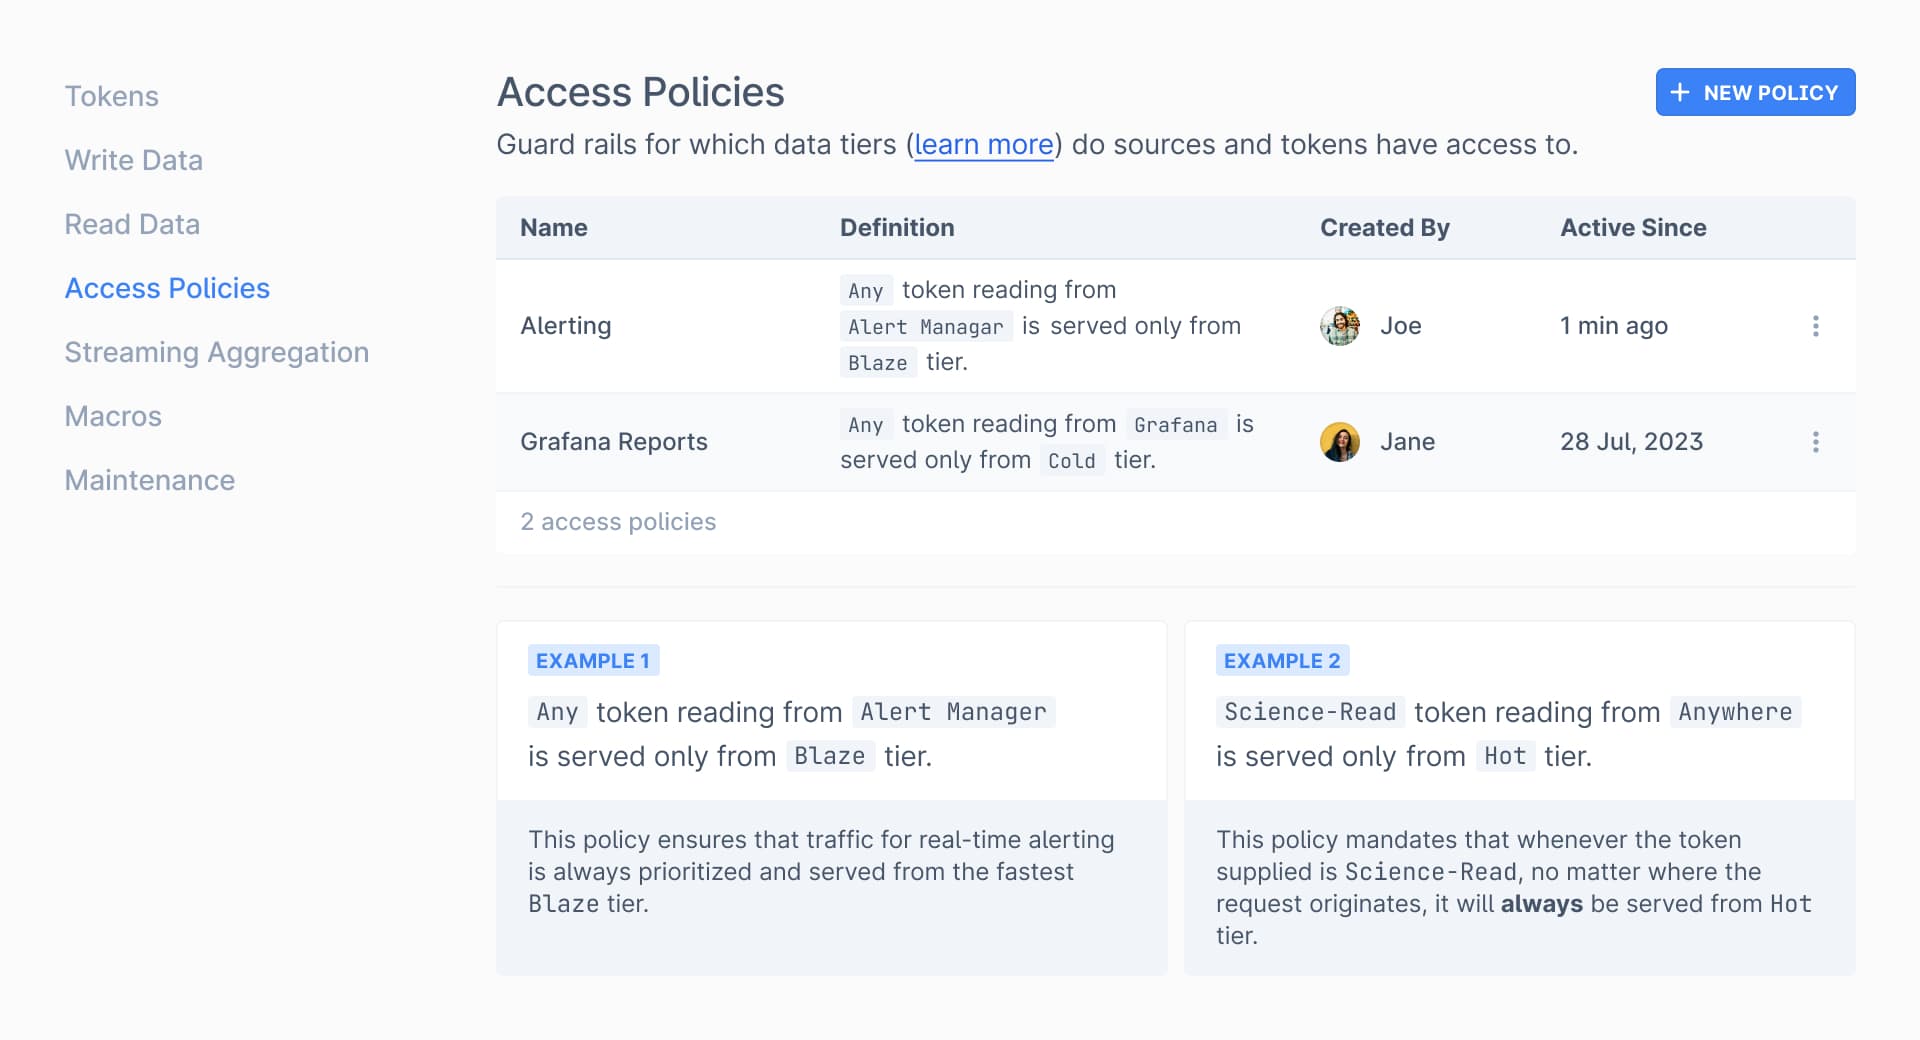
Example Access Policies
| Policy | Implications |
|---|---|
| Any token from Alert Manager will only read from Blaze Tier. | This policy ensures that traffic for real-time alerting is always prioritized and served from the fastest Blaze tier. |
| Science-Read token from Anywhere will only read from Hot Tier. | This policy mandates that whenever the token supplied is Science-Read, no matter where the request originates, it will always be served from Hot tier. |
Data Policy
Data Policies control how data moves in and out of Tiers based on Access
Frequency and Time. These are currently system defaults but can be
configured on request.
| Tier | Time To Live |
|---|---|
| Blaze | 2 hours |
| Hot | 3 months |
To know more about Last9's capabilities, Book a Demo with us.